Delta Airlines 2014 Annual Report Download - page 36
Download and view the complete annual report
Please find page 36 of the 2014 Delta Airlines annual report below. You can navigate through the pages in the report by either clicking on the pages listed below, or by using the keyword search tool below to find specific information within the annual report.-
 1
1 -
2
-
3
-
4
-
5
-
6
-
7
-
8
-
9
-
10
-
11
-
12
-
13
-
14
-
15
-
16
-
17
-
18
-
19
-
20
-
21
-
22
-
23
-
24
-
25
-
 26
26 -
 27
27 -
 28
28 -
 29
29 -
 30
30 -
 31
31 -
 32
32 -
 33
33 -
 34
34 -
 35
35 -
 36
36 -
 37
37 -
 38
38 -
 39
39 -
 40
40 -
 41
41 -
 42
42 -
 43
43 -
 44
44 -
 45
45 -
 46
46 -
47
-
48
-
49
-
50
-
51
-
52
-
53
-
54
-
55
-
56
-
57
-
58
-
59
-
60
-
61
-
62
-
63
-
64
-
65
-
66
-
67
-
68
-
69
-
70
-
71
-
72
-
73
-
74
-
75
-
76
-
77
-
78
-
79
-
80
-
81
-
82
-
83
-
84
-
85
-
86
-
87
-
88
-
89
-
90
-
91
-
92
-
93
-
94
-
95
-
96
-
97
-
98
-
99
-
100
-
101
-
102
-
103
-
104
-
105
-
106
-
107
-
108
-
109
-
110
-
111
-
112
-
113
-
114
-
115
-
116
-
117
-
118
-
119
-
120
-
121
-
122
-
123
-
124
-
125
-
126
-
127
-
128
-
129
-
130
-
131
-
132
-
133
-
134
-
135
-
136
-
137
-
138
-
139
-
140
-
141
-
142
-
143
-
144
-
145
-
146
-
147
-
148
-
149
-
150
-
151
-
152
-
153
-
154
-
155
-
156
-
157
-
158
-
159
-
160
-
161
-
162
-
163
-
164
-
165
-
166
-
167
-
168
-
169
-
170
-
171
-
172
-
173
-
174
-
175
-
176
-
177
-
178
-
179
-
180
-
181
-
182
-
183
-
184
-
185
-
186
-
187
-
188
-
189
-
190
-
191
-
192
-
193
-
194
-
195
-
196
-
197
-
198
-
199
-
200
-
201
-
202
-
203
-
204
-
205
-
206
-
207
-
208
-
209
-
210
-
211
-
212
-
213
-
214
-
215
-
216
-
217
-
218
-
219
-
220
-
221
-
222
-
223
-
224
-
225
-
226
-
227
-
228
-
229
-
230
-
231
-
232
-
233
-
234
-
235
-
236
-
237
-
238
-
239
-
240
-
241
-
242
-
243
-
244
-
245
-
246
-
247
-
248
-
249
-
250
-
251
-
252
-
253
-
254
-
255
-
256
-
257
-
258
-
259
-
260
-
261
-
262
-
263
-
264
-
265
-
266
-
267
-
268
-
269
-
270
-
271
-
272
-
273
-
274
-
275
-
276
-
277
-
278
-
279
-
280
-
281
-
282
-
283
-
284
-
285
-
286
-
287
-
288
-
289
-
290
-
291
-
292
-
293
-
294
-
295
-
296
-
297
-
298
-
299
-
300
-
301
-
302
-
303
-
304
-
305
-
306
-
307
-
308
-
309
-
310
-
311
-
312
-
313
-
314
-
315
-
316
-
317
-
318
-
319
-
320
-
321
-
322
-
323
-
324
-
325
-
326
-
327
-
328
-
329
-
330
-
331
-
332
-
333
-
334
-
335
-
336
-
337
-
338
-
339
-
340
-
341
-
342
-
343
-
344
-
345
-
346
-
347
-
348
-
349
-
350
-
351
-
352
-
353
-
354
-
355
-
356
-
357
-
358
-
359
-
360
-
361
-
362
-
363
-
364
-
365
-
366
-
367
-
368
-
369
-
370
-
371
-
372
-
373
-
374
-
375
-
376
-
377
-
378
-
379
-
380
-
381
-
382
-
383
-
384
-
385
-
386
-
387
-
388
-
389
-
390
-
391
-
392
-
393
-
394
-
395
-
396
-
397
-
398
-
399
-
400
-
401
-
402
-
403
-
404
-
405
-
406
-
407
-
408
-
409
-
410
-
411
-
412
-
413
-
414
-
415
-
416
-
417
-
418
-
419
-
420
-
421
-
422
-
423
-
424
-
425
-
426
-
427
-
428
-
429
-
430
-
431
-
432
-
433
-
434
-
435
-
436
-
437
-
438
-
439
-
440
-
441
-
442
-
443
-
444
-
445
-
446
-
447
-
448
-
449
-
450
-
451
-
452
-
453
-
454
-
455
-
456
 |
 |

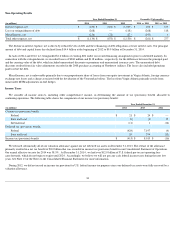
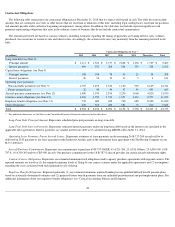
Results of Operations - 2013 Compared to 2012
Operating Revenue
Passenger Revenue
Passenger revenue increased $1.2 billion , or 4% , on a 3% PRASM increase and a 3% increase in passenger mile yield. Revenue remained strong
despite lower fuel prices. In addition, the increase in passenger revenue reflects in-flight product enhancements such as the Economy Comfort product
and higher corporate sales.
Our geographic regions performed well compared to the prior year, with the domestic region leading year-over-year unit revenue improvement as a
result of higher passenger mile yield. Unit revenues of the domestic region rose by over 5% with notable improvements in the New York market. New
York unit revenues increased as we continue to see improvements due to our investments in JFK and LaGuardia, as well as many in-flight product
enhancements. Revenues related to our international regions increased 3% year-over-year, with slight unit revenue improvements in both Atlantic and
Latin America regions. Our Pacific region experienced a slight decline in unit revenues primarily due to the Japanese yen devaluation.
31
Year Ended December 31,
Increase % Increase (in millions) 2013 2012
Passenger:
Mainline
$
26,534
$
25,173
$
1,361
5
%
Regional carriers
6,408
6,581
(173
)
(3
)%
Total passenger revenue
32,942
31,754
1,188
4
%
Cargo
937
990
(53
)
(5
)%
Other
3,894
3,926
(32
)
(1
)%
Total operating revenue
$
37,773
$
36,670
$
1,103
3
%
Increase (Decrease)
vs. Year Ended December 31, 2012
(in millions) Year Ended
December 31, 2013 Passenger
Revenue RPMs
(Traffic) ASMs
(Capacity) Passenger
Mile Yield PRASM Load Factor
Domestic
$
15,204
8
%
1
%
2
%
6
%
5
%
(0.8
)
pts
Atlantic
5,657
3
%
1
%
(1
)%
2
%
3
%
1.2
pts
Pacific
3,561
(2
)%
1
%
(1
)%
(2
)%
(1
)%
1.3
pts
Latin America
2,112
11
%
11
%
8
%
(1
)%
2
%
2.3
pts
Total mainline
26,534
5
%
2
%
2
%
3
%
4
%
0.3
pts
Regional carriers
6,408
(3
)%
(6
)%
(3
)%
3
%
1
%
(1.8
)
pts
Total consolidated
$
32,942
4
%
1
%
1
%
3
%
3
%
—
pts