Delta Airlines 2014 Annual Report Download - page 47
Download and view the complete annual report
Please find page 47 of the 2014 Delta Airlines annual report below. You can navigate through the pages in the report by either clicking on the pages listed below, or by using the keyword search tool below to find specific information within the annual report.-
 1
1 -
2
-
3
-
4
-
5
-
6
-
7
-
8
-
9
-
10
-
11
-
12
-
13
-
14
-
15
-
16
-
17
-
18
-
19
-
20
-
21
-
22
-
23
-
24
-
25
-
26
-
27
-
28
-
29
-
30
-
31
-
32
-
33
-
34
-
35
-
36
-
 37
37 -
 38
38 -
 39
39 -
 40
40 -
 41
41 -
 42
42 -
 43
43 -
 44
44 -
 45
45 -
 46
46 -
 47
47 -
 48
48 -
 49
49 -
 50
50 -
 51
51 -
 52
52 -
 53
53 -
 54
54 -
 55
55 -
 56
56 -
 57
57 -
58
-
59
-
60
-
61
-
62
-
63
-
64
-
65
-
66
-
67
-
68
-
69
-
70
-
71
-
72
-
73
-
74
-
75
-
76
-
77
-
78
-
79
-
80
-
81
-
82
-
83
-
84
-
85
-
86
-
87
-
88
-
89
-
90
-
91
-
92
-
93
-
94
-
95
-
96
-
97
-
98
-
99
-
100
-
101
-
102
-
103
-
104
-
105
-
106
-
107
-
108
-
109
-
110
-
111
-
112
-
113
-
114
-
115
-
116
-
117
-
118
-
119
-
120
-
121
-
122
-
123
-
124
-
125
-
126
-
127
-
128
-
129
-
130
-
131
-
132
-
133
-
134
-
135
-
136
-
137
-
138
-
139
-
140
-
141
-
142
-
143
-
144
-
145
-
146
-
147
-
148
-
149
-
150
-
151
-
152
-
153
-
154
-
155
-
156
-
157
-
158
-
159
-
160
-
161
-
162
-
163
-
164
-
165
-
166
-
167
-
168
-
169
-
170
-
171
-
172
-
173
-
174
-
175
-
176
-
177
-
178
-
179
-
180
-
181
-
182
-
183
-
184
-
185
-
186
-
187
-
188
-
189
-
190
-
191
-
192
-
193
-
194
-
195
-
196
-
197
-
198
-
199
-
200
-
201
-
202
-
203
-
204
-
205
-
206
-
207
-
208
-
209
-
210
-
211
-
212
-
213
-
214
-
215
-
216
-
217
-
218
-
219
-
220
-
221
-
222
-
223
-
224
-
225
-
226
-
227
-
228
-
229
-
230
-
231
-
232
-
233
-
234
-
235
-
236
-
237
-
238
-
239
-
240
-
241
-
242
-
243
-
244
-
245
-
246
-
247
-
248
-
249
-
250
-
251
-
252
-
253
-
254
-
255
-
256
-
257
-
258
-
259
-
260
-
261
-
262
-
263
-
264
-
265
-
266
-
267
-
268
-
269
-
270
-
271
-
272
-
273
-
274
-
275
-
276
-
277
-
278
-
279
-
280
-
281
-
282
-
283
-
284
-
285
-
286
-
287
-
288
-
289
-
290
-
291
-
292
-
293
-
294
-
295
-
296
-
297
-
298
-
299
-
300
-
301
-
302
-
303
-
304
-
305
-
306
-
307
-
308
-
309
-
310
-
311
-
312
-
313
-
314
-
315
-
316
-
317
-
318
-
319
-
320
-
321
-
322
-
323
-
324
-
325
-
326
-
327
-
328
-
329
-
330
-
331
-
332
-
333
-
334
-
335
-
336
-
337
-
338
-
339
-
340
-
341
-
342
-
343
-
344
-
345
-
346
-
347
-
348
-
349
-
350
-
351
-
352
-
353
-
354
-
355
-
356
-
357
-
358
-
359
-
360
-
361
-
362
-
363
-
364
-
365
-
366
-
367
-
368
-
369
-
370
-
371
-
372
-
373
-
374
-
375
-
376
-
377
-
378
-
379
-
380
-
381
-
382
-
383
-
384
-
385
-
386
-
387
-
388
-
389
-
390
-
391
-
392
-
393
-
394
-
395
-
396
-
397
-
398
-
399
-
400
-
401
-
402
-
403
-
404
-
405
-
406
-
407
-
408
-
409
-
410
-
411
-
412
-
413
-
414
-
415
-
416
-
417
-
418
-
419
-
420
-
421
-
422
-
423
-
424
-
425
-
426
-
427
-
428
-
429
-
430
-
431
-
432
-
433
-
434
-
435
-
436
-
437
-
438
-
439
-
440
-
441
-
442
-
443
-
444
-
445
-
446
-
447
-
448
-
449
-
450
-
451
-
452
-
453
-
454
-
455
-
456
 |
 |

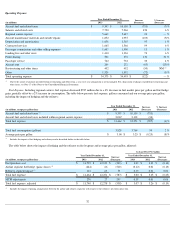
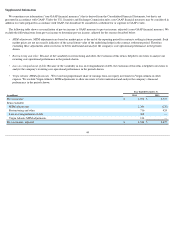
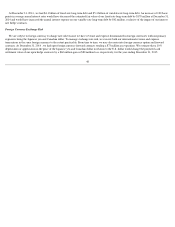
We recorded a full valuation allowance in 2004 due to our cumulative loss position at that time. During 2013 , after considering all positive and
negative evidence, we concluded that our deferred income tax assets are more likely than not to be realized. Accordingly, we released substantially all
of the valuation allowance against our net deferred income tax assets. We recognized an $8.0 billion benefit in our provision for income taxes,
primarily related to the valuation allowance release.
At the end of 2014 our net deferred tax asset balance was $7.6 billion , against which we maintained a $46 million valuation allowance, primarily
related to state net operating losses with limited expiration periods.
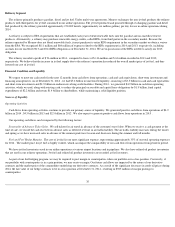
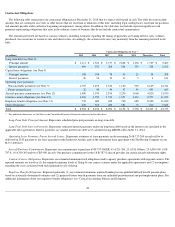
Defined Benefit Pension Plans
We sponsor defined benefit pension plans for eligible employees and retirees. These plans are closed to new entrants and frozen for future benefit
accruals. As of December 31, 2014 , the unfunded benefit obligation for these plans recorded on our Consolidated Balance Sheet was $12.5 billion .
During 2014 , we contributed $917 million to these plans and recorded $233 million of expense in salaries and related costs on our Consolidated
Statement of Operations. In 2015, we estimate we will contribute at least $950 million to these plans, including $340 million
of contributions above the
minimum funding requirements, and that our expense will be approximately $250 million. The most critical assumptions impacting our defined benefit
pension plan obligations and expenses are the discount rate, the expected long-term rate of return on plan assets and life expectancy.
Weighted Average Discount Rate. We determine our weighted average discount rate on our measurement date primarily by reference to annualized
rates earned on high quality fixed income investments and yield-to-maturity analysis specific to our estimated future benefit payments. We used a
weighted average discount rate to value the obligations of 4.14% and 5.01% at December 31, 2014 and 2013 , respectively. Our weighted average
discount rate for net periodic pension benefit cost in each of the past three years has varied from the rate selected on our measurement date, ranging
from 4.10% to 4.99% between 2014 and 2012 .
Expected Long-Term Rate of Return. Our expected long-term rate of return on plan assets is based primarily on plan-specific investment studies
using historical market return and volatility data. Modest excess return expectations versus some public market indices are incorporated into the return
projections based on the actively managed structure of the investment programs and their records of achieving such returns historically. We also expect
to receive a premium for investing in less liquid private markets. We review our rate of return on plan asset assumptions annually. Our annual
investment performance for one particular year does not, by itself, significantly influence our evaluation. Our actual historical annualized three and
five year rate of return on plan assets for our defined benefit pension plans was approximately 11% and 9% , respectively, as of December 31, 2014 .
The investment strategy for our defined benefit pension plan assets is to earn a long-term return that meets or exceeds our annualized return target
while taking an acceptable level of risk and maintaining sufficient liquidity to pay current benefits and other cash obligations of the plan. This is
achieved by investing in a globally diversified mix of public and private equity, fixed income, real assets, hedge funds, and other assets and
instruments. Our expected long-term rate of return on assets for net periodic pension benefit cost for the year ended December 31, 2014 was 9% .
Life Expectancy . We have historically utilized the Society of Actuaries' ("SOA") published mortality data in developing a best estimate of life
expectancy. On October 27, 2014, the SOA published updated mortality tables for U.S. plans and an updated improvement scale, which both reflect
improved longevity. Based on an evaluation of these new tables and our perspective of future longevity, we updated the mortality assumptions for
purposes of measuring pension and other postretirement and postemployment benefit obligations at December 31, 2014 . The improvement in life
expectancy increases our benefit obligations and future expense as benefit payments are paid over an extended period of time.
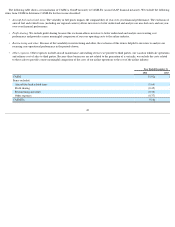
The impact of a 0.50% change in these assumptions is shown in the table below:
42
Change in Assumption Effect on 2015
Pension Expense
Effect on Accrued
Pension Liability at
December 31, 2014
0.50% decrease in weighted average discount rate -$4 million +$1.5 billion
0.50% increase in weighted average discount rate -$3 million -$1.4 billion
0.50% decrease in expected long-term rate of return on assets +$48 million —
0.50% increase in expected long-term rate of return on assets -$48 million —