Dell 2007 Annual Report Download - page 92
Download and view the complete annual report
Please find page 92 of the 2007 Dell annual report below. You can navigate through the pages in the report by either clicking on the pages listed below, or by using the keyword search tool below to find specific information within the annual report.-
 1
1 -
2
-
3
-
4
-
5
-
6
-
7
-
8
-
9
-
10
-
11
-
12
-
13
-
14
-
15
-
16
-
17
-
18
-
19
-
20
-
21
-
22
-
23
-
24
-
25
-
26
-
27
-
28
-
29
-
30
-
31
-
32
-
33
-
34
-
35
-
36
-
37
-
38
-
39
-
40
-
41
-
42
-
43
-
44
-
45
-
46
-
47
-
48
-
49
-
50
-
51
-
52
-
53
-
54
-
55
-
56
-
57
-
58
-
59
-
60
-
61
-
62
-
63
-
64
-
65
-
66
-
67
-
68
-
69
-
70
-
71
-
72
-
73
-
74
-
75
-
76
-
77
-
78
-
79
-
80
-
81
-
 82
82 -
 83
83 -
 84
84 -
 85
85 -
 86
86 -
 87
87 -
 88
88 -
 89
89 -
 90
90 -
 91
91 -
 92
92 -
 93
93 -
 94
94 -
 95
95 -
 96
96 -
 97
97 -
 98
98 -
 99
99 -
 100
100 -
 101
101 -
 102
102 -
103
-
104
-
105
-
106
-
107
-
108
-
109
-
110
-
111
-
112
-
113
-
114
-
115
-
116
-
117
-
118
-
119
-
120
-
121
-
122
-
123
-
124
-
125
-
126
-
127
-
128
-
129
-
130
-
131
-
132
-
133
-
134
-
135
-
136
-
137
-
138
-
139
-
140
-
141
-
142
-
143
-
144
-
145
-
146
-
147
-
148
-
149
-
150
-
151
-
152
-
153
-
154
-
155
-
156
-
157
-
158
-
159
-
160
-
161
-
162
-
163
-
164
-
165
-
166
-
167
-
168
-
169
-
170
-
171
-
172
-
173
-
174
-
175
-
176
-
177
-
178
-
179
-
180
-
181
-
182
-
183
-
184
-
185
-
186
-
187
-
188
-
189
-
190
-
191
-
192
-
193
-
194
-
195
-
196
-
197
-
198
-
199
-
200
-
201
-
202
-
203
-
204
-
205
-
206
-
207
-
208
-
209
-
210
-
211
-
212
-
213
-
214
-
215
-
216
-
217
-
218
-
219
-
220
-
221
-
222
-
223
-
224
-
225
-
226
-
227
-
228
-
229
-
230
-
231
-
232
-
233
-
234
-
235
-
236
-
237
-
238
-
239
 |
 |
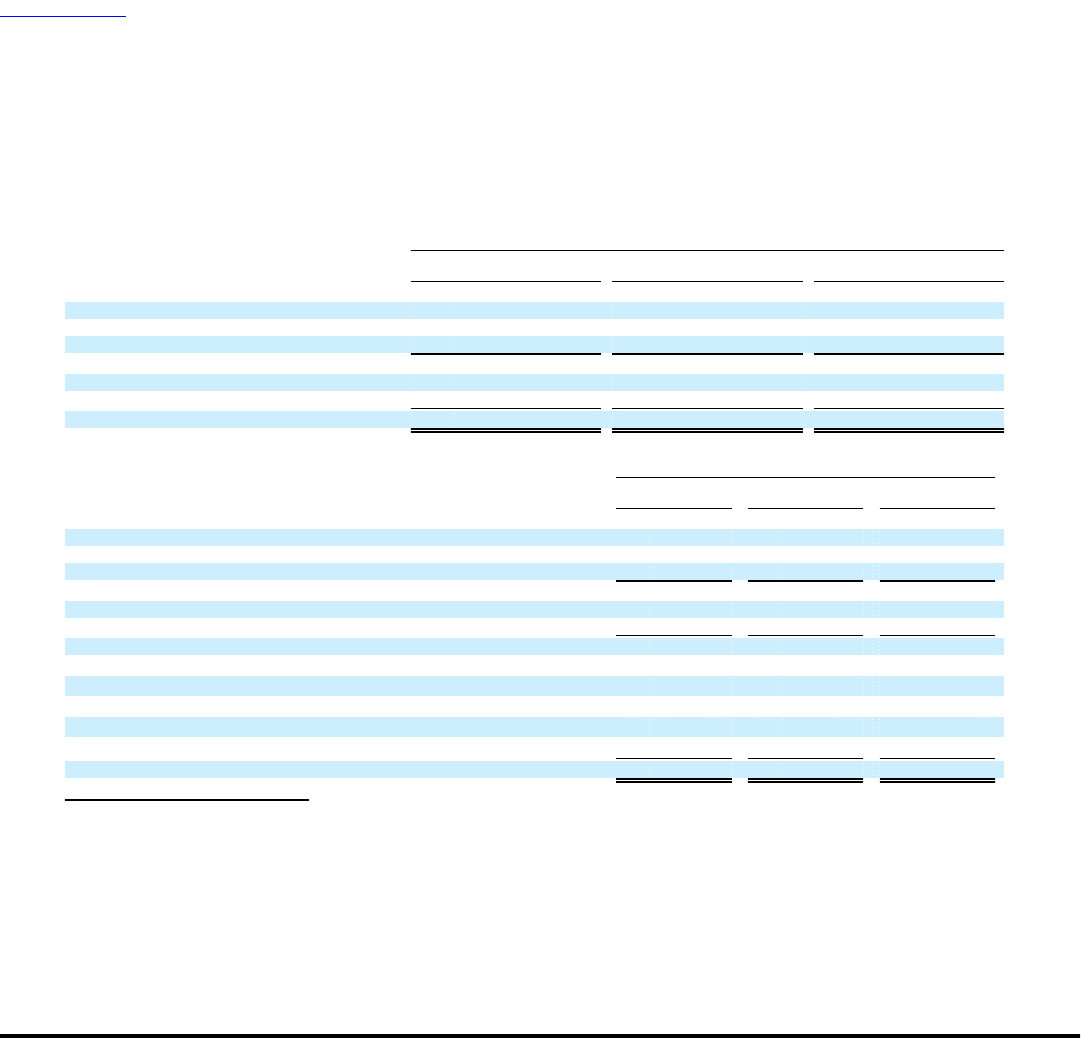
Table of Contents
DELL INC.
NOTES TO CONSOLIDATED FINANCIAL STATEMENTS (Continued)
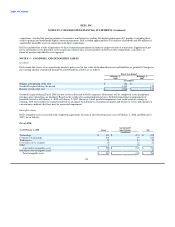
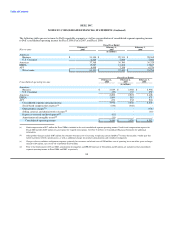
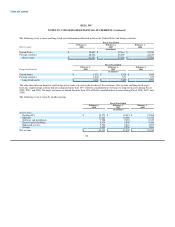
The following tables present revenue by Dell's reportable segments as well as a reconciliation of consolidated segment operating income
to Dell's consolidated operating income for Fiscal 2008, Fiscal 2007, and Fiscal 2006:
Fiscal Year Ended
February 1, February 2, February 3,
Net revenue 2008 2007 2006
(in millions)
Americas:
Business $ 31,144 $ 29,311 $ 28,365
U.S. Consumer 6,224 7,069 7,960
Americas 37,368 36,380 36,325
EMEA 15,267 13,682 12,887
APJ 8,498 7,358 6,576
Net revenue $ 61,133 $ 57,420 $ 55,788
Fiscal Year Ended
February 1, February 2, February 3,
Consolidated operating income 2008 2007 2006
(in millions)
Americas:
Business $ 2,549 $ 2,388 $ 2,956
U.S. Consumer (59) 135 452
Americas 2,490 2,523 3,408
EMEA 1,009 583 871
APJ 471 332 524
Consolidated segment operating income 3,970 3,438 4,803
Stock-based compensation expense(a) (436) (368) -
Other product charges(b) - - (338)
Selling, general, and administrative charges(c) - - (83)
In-process research and development(d) (83) - -
Amortization of intangible assets(d) (11) - -
Consolidated operating income $ 3,440 $ 3,070 $ 4,382
(a) Stock compensation of $17 million for Fiscal 2006 is included in the total consolidated segment operating income. Stock-based compensation expense for
Fiscal 2008 includes $107 million of cash expense for expired stock options. See Note 5 of Notes to Consolidated Financial Statements for additional
information.
(b) Other product charges include $307 million for estimated warranty costs of servicing or replacing certain OptiPlexTMsystems that include a vendor part that
failed to perform to Dell's specifications, as well as additional charges for product rationalizations and workforce realignment.
(c) Charges relate to workforce realignment expenses, primarily for severance and related costs of $50 million, cost of operating leases on office space no longer
utilized of $4 million, and a write-off of goodwill of $29 million.
(d) Prior to the fourth quarter of Fiscal 2008, amortization of intangibles and IPR&D expenses of $16 million and $5 million are included in total consolidated
segment operating income in Fiscal 2008 and 2007, respectively.
88