Dell 2007 Annual Report Download - page 31
Download and view the complete annual report
Please find page 31 of the 2007 Dell annual report below. You can navigate through the pages in the report by either clicking on the pages listed below, or by using the keyword search tool below to find specific information within the annual report.-
 1
1 -
2
-
3
-
4
-
5
-
6
-
7
-
8
-
9
-
10
-
11
-
12
-
13
-
14
-
15
-
16
-
17
-
18
-
19
-
20
-
 21
21 -
 22
22 -
 23
23 -
 24
24 -
 25
25 -
 26
26 -
 27
27 -
 28
28 -
 29
29 -
 30
30 -
 31
31 -
 32
32 -
 33
33 -
 34
34 -
 35
35 -
 36
36 -
 37
37 -
 38
38 -
 39
39 -
 40
40 -
 41
41 -
42
-
43
-
44
-
45
-
46
-
47
-
48
-
49
-
50
-
51
-
52
-
53
-
54
-
55
-
56
-
57
-
58
-
59
-
60
-
61
-
62
-
63
-
64
-
65
-
66
-
67
-
68
-
69
-
70
-
71
-
72
-
73
-
74
-
75
-
76
-
77
-
78
-
79
-
80
-
81
-
82
-
83
-
84
-
85
-
86
-
87
-
88
-
89
-
90
-
91
-
92
-
93
-
94
-
95
-
96
-
97
-
98
-
99
-
100
-
101
-
102
-
103
-
104
-
105
-
106
-
107
-
108
-
109
-
110
-
111
-
112
-
113
-
114
-
115
-
116
-
117
-
118
-
119
-
120
-
121
-
122
-
123
-
124
-
125
-
126
-
127
-
128
-
129
-
130
-
131
-
132
-
133
-
134
-
135
-
136
-
137
-
138
-
139
-
140
-
141
-
142
-
143
-
144
-
145
-
146
-
147
-
148
-
149
-
150
-
151
-
152
-
153
-
154
-
155
-
156
-
157
-
158
-
159
-
160
-
161
-
162
-
163
-
164
-
165
-
166
-
167
-
168
-
169
-
170
-
171
-
172
-
173
-
174
-
175
-
176
-
177
-
178
-
179
-
180
-
181
-
182
-
183
-
184
-
185
-
186
-
187
-
188
-
189
-
190
-
191
-
192
-
193
-
194
-
195
-
196
-
197
-
198
-
199
-
200
-
201
-
202
-
203
-
204
-
205
-
206
-
207
-
208
-
209
-
210
-
211
-
212
-
213
-
214
-
215
-
216
-
217
-
218
-
219
-
220
-
221
-
222
-
223
-
224
-
225
-
226
-
227
-
228
-
229
-
230
-
231
-
232
-
233
-
234
-
235
-
236
-
237
-
238
-
239
 |
 |

Table of Contents
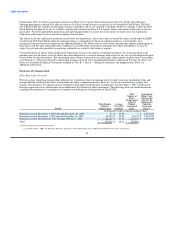
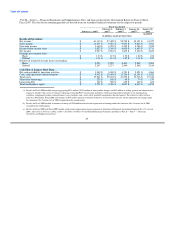
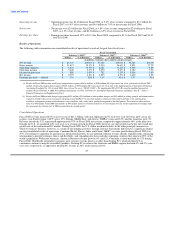
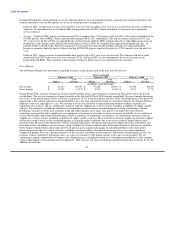
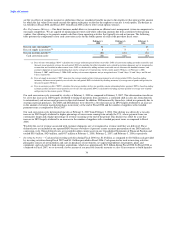
Revenue by Product and Services Categories
The following table summarizes our net revenue by product category:
Fiscal Year Ended
February 1, 2008 February 2, 2007 February 3, 2006
% of % of % of
Dollars Revenue Dollars Revenue Dollars Revenue
(in millions, except percentage)
Net revenue:
Desktop PCs $ 19,573 32% $ 19,815 34% $ 21,568 39%
Mobility 17,423 28% 15,480 27% 14,372 25%
Software and peripherals 9,908 16% 9,001 16% 8,329 15%
Servers and networking 6,474 11% 5,805 10% 5,449 10%
Services 5,320 9% 5,063 9% 4,207 8%
Storage 2,435 4% 2,256 4% 1,863 3%
Net revenue $ 61,133 100% $ 57,420 100% $ 55,788 100%
• Desktop PCs — During Fiscal 2008, revenue from desktop PCs (which includes desktop computer systems and workstations)
decreased slightly from Fiscal 2007 revenue on a unit decline of 2% even though worldwide industry unit sales grew 5% during
calendar 2007. The decline was primarily due to us being out of product feature and price position and consumers' migration to
mobility products. Our U.S. Consumer segment continued to perform below expectation in Fiscal 2008 with a 19% decrease in
desktop revenue year-over-year; however, in the fourth quarter of Fiscal 2008, desktop revenues for U.S. Consumers grew 5% over
the fourth quarter of Fiscal 2007. U.S. Consumer was the primary contributor to our worldwide full year decline in desktop revenue
with EMEA also contributing to the decline with a 3% decrease in revenue during Fiscal 2008 as compared to Fiscal 2007. The
decline in revenue in our U.S. Consumer and EMEA segments was offset by a strong performance in APJ, where desktop sales
increased 12% during Fiscal 2008 over prior year, while desktop sales in our Americas Business segment remained relatively flat
during the same time period. We will likely see rising user demand for mobility products in the foreseeable future that will contribute
to a slowing demand for desktop PCs as mobility growth is expected to outpace desktop growth at a rate of approximately six-to-one.
In Fiscal 2008, we introduced VostroTM desktops specifically designed to meet the needs of small business customers.
In Fiscal 2007, revenue from desktop PCs decreased 8% year-over-year on unit decline of 5%. Desktop PCs in the Americas declined
year-over-year during Fiscal 2007, but was offset by single-digit growth in the APJ region during the same period. Desktop PCs, as
compared to mobility products, led Fiscal 2007 in volume; however, our desktop PC average selling price decreased 3% from Fiscal
2006 to Fiscal 2007, which contributed to the overall revenue decline.
• Mobility — In Fiscal 2008, revenue from mobility products (which includes notebook computers and mobile workstations) grew 13%
year-over-year on unit growth of 16%. All segments experienced strong growth except U.S. Consumer, whose revenue and units
declined 10% during Fiscal 2008 as compared to Fiscal 2007. During the same period mobility revenue in APJ grew 33% on unit
growth of 32%; EMEA revenue grew 20% on unit growth of 24%; and Americas Business revenue grew 11% on 17% unit growth.
Even though we posted double-digit mobility growth during Fiscal 2008, according to IDC, industry mobility shipments grew 34%
during calendar 2007. To capitalize on the industry growth in mobility, we have separated our consumer and commercial design
functions — focusing our consumer team on innovation and shorter design cycles. As a result, we have launched four consumer
notebook families in the past six months, including InspironTM color laptops and XPSTM laptops, for which the demand has been
better than expected. As a result, the fourth quarter of Fiscal 2008 mobility revenues for U.S. Consumer grew 25% over the fourth
quarter of Fiscal 2007. We also introduced VostroTM laptops, specifically designed to meet the needs of small business customers.
During the fourth quarter of Fiscal 2008, we launched our first tablet — the LatitudeTM XT, the industry's only sub-four pound
convertible tablet with pen and touch capability. As notebooks become more affordable and wireless
27