Dell 2007 Annual Report Download - page 28
Download and view the complete annual report
Please find page 28 of the 2007 Dell annual report below. You can navigate through the pages in the report by either clicking on the pages listed below, or by using the keyword search tool below to find specific information within the annual report.-
 1
1 -
2
-
3
-
4
-
5
-
6
-
7
-
8
-
9
-
10
-
11
-
12
-
13
-
14
-
15
-
16
-
17
-
 18
18 -
 19
19 -
 20
20 -
 21
21 -
 22
22 -
 23
23 -
 24
24 -
 25
25 -
 26
26 -
 27
27 -
 28
28 -
 29
29 -
 30
30 -
 31
31 -
 32
32 -
 33
33 -
 34
34 -
 35
35 -
 36
36 -
 37
37 -
 38
38 -
39
-
40
-
41
-
42
-
43
-
44
-
45
-
46
-
47
-
48
-
49
-
50
-
51
-
52
-
53
-
54
-
55
-
56
-
57
-
58
-
59
-
60
-
61
-
62
-
63
-
64
-
65
-
66
-
67
-
68
-
69
-
70
-
71
-
72
-
73
-
74
-
75
-
76
-
77
-
78
-
79
-
80
-
81
-
82
-
83
-
84
-
85
-
86
-
87
-
88
-
89
-
90
-
91
-
92
-
93
-
94
-
95
-
96
-
97
-
98
-
99
-
100
-
101
-
102
-
103
-
104
-
105
-
106
-
107
-
108
-
109
-
110
-
111
-
112
-
113
-
114
-
115
-
116
-
117
-
118
-
119
-
120
-
121
-
122
-
123
-
124
-
125
-
126
-
127
-
128
-
129
-
130
-
131
-
132
-
133
-
134
-
135
-
136
-
137
-
138
-
139
-
140
-
141
-
142
-
143
-
144
-
145
-
146
-
147
-
148
-
149
-
150
-
151
-
152
-
153
-
154
-
155
-
156
-
157
-
158
-
159
-
160
-
161
-
162
-
163
-
164
-
165
-
166
-
167
-
168
-
169
-
170
-
171
-
172
-
173
-
174
-
175
-
176
-
177
-
178
-
179
-
180
-
181
-
182
-
183
-
184
-
185
-
186
-
187
-
188
-
189
-
190
-
191
-
192
-
193
-
194
-
195
-
196
-
197
-
198
-
199
-
200
-
201
-
202
-
203
-
204
-
205
-
206
-
207
-
208
-
209
-
210
-
211
-
212
-
213
-
214
-
215
-
216
-
217
-
218
-
219
-
220
-
221
-
222
-
223
-
224
-
225
-
226
-
227
-
228
-
229
-
230
-
231
-
232
-
233
-
234
-
235
-
236
-
237
-
238
-
239
 |
 |

Table of Contents
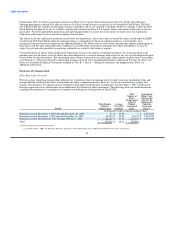
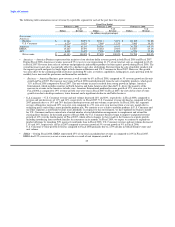
Fiscal 2007 revenue increased 3% year-over-year to $57.4 billion, with unit shipments up 2% year-over-year. Revenue grew across the
EMEA and APJ regions by 6% and 12%, respectively, while the Americas region revenue remained flat year-over-year. Revenue outside
the U.S. represented approximately 44% of Fiscal 2007 net revenue, compared to approximately 41% in the prior year. Outside the U.S.,
we produced 10% year-over-year revenue growth for Fiscal 2007. During Fiscal 2007, Americas Business revenue grew by 3% and
U.S. Consumer revenue declined by 11%. All product categories grew revenue over the prior year periods, other than desktop PCs.
Desktop PC revenue in the Americas and EMEA regions declined 12% and 6% year-over-year, respectively. We believe that this decline
in desktop PC revenue reflected an industry-wide shift to mobility products. Our growth underperformed the industry's growth in Fiscal
2007, particularly in our U.S. Consumer segment, as we were out of product feature set and price position.
Operating income and net income increased 12% and 14% year-over-year to $3.4 billion and $2.9 billion, respectively, for Fiscal 2008.
The increased profitability was mainly a result of strength in mobility, solid demand for enterprise products, and a favorable component-
cost environment. In Fiscal 2007 and Fiscal 2006, operating and net income were $3.1 billion and $2.6 billion, and $4.4 billion and
$3.6 billion, respectively. Net income for Fiscal 2006 includes an income tax repatriation benefit of $85 million pursuant to a favorable
tax incentive provided by the American Jobs Creation Act of 2004. This tax benefit is related to the Fiscal 2006 repatriation of
$4.1 billion in foreign earnings.
Our average selling price (total revenue per unit sold) in Fiscal 2008 increased 2% year-over-year, which primarily resulted from our
pricing strategy, compared to a 1% year-over-year increase for Fiscal 2007. Our recent pricing strategy has been to concentrate on
solutions sales, realign pricing, and drive a better mix of products and services, while aggressively pricing our products to remain
competitive in the marketplace. In Fiscal 2008, we continued to see intense competitive pressure, particularly for lower priced desktops
and notebooks, as competitors offered aggressively priced products with better product recognition and more relevant feature sets. As a
result, particularly in the U.S., we lost share in the U.S. consumer segment in notebooks and desktops, which slowed our overall growth
in unit shipments, revenue, and profitability. We expect that this competitive pricing environment will continue for the foreseeable future.
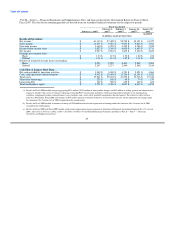
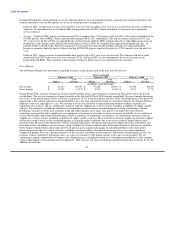
Revenues by Segment
We conduct operations worldwide and manage our business in three geographic regions: the Americas, EMEA, and APJ. The Americas
region covers the U.S., Canada, and Latin America. Within the Americas, we are further segmented into Business and U.S. Consumer.
The Americas Business ("Business") segment includes sales to corporate, government, healthcare, small and medium business, and
education customers, while the U.S. Consumer segment includes sales primarily to individual consumers and selected retailers within the
U.S. We have developed and started implementing a plan to combine the consumer business of both EMEA and APJ with the
U.S. Consumer business and re-align our management and financial reporting structure. We will begin reporting worldwide Consumer
once we complete the global consolidation of this business, which we expect to be the first quarter of Fiscal 2009. The changes have had
no impact on our operating segment structure to date. The EMEA region covers Europe, the Middle East, and Africa. The APJ region
covers the Asian countries of the Pacific Rim as well as Australia, New Zealand, and India.
During the second half of Fiscal 2008, we began selling desktop and notebook computers, printers, ink, and toner through retail channels
in the Americas, EMEA, and APJ in order to expand our customer base. Our goal is to have strategic relationships with a number of
major retailers in our larger geographic regions. In the U.S., we currently have relationships with retailers such as Staples, Wal-Mart, and
Best Buy; and in Latin America, we have relationships with retailers, including Wal-Mart and Pontofrio. Additionally, some of our
relationships include Carphone Warehouse, Carrefour, Tesco, and DSGi in EMEA; and in APJ, we are working with retailers such as
Gome, HiMart, Courts, and Bic Camera.
24