Dell 2007 Annual Report Download - page 40
Download and view the complete annual report
Please find page 40 of the 2007 Dell annual report below. You can navigate through the pages in the report by either clicking on the pages listed below, or by using the keyword search tool below to find specific information within the annual report.-
 1
1 -
2
-
3
-
4
-
5
-
6
-
7
-
8
-
9
-
10
-
11
-
12
-
13
-
14
-
15
-
16
-
17
-
18
-
19
-
20
-
21
-
22
-
23
-
24
-
25
-
26
-
27
-
28
-
29
-
 30
30 -
 31
31 -
 32
32 -
 33
33 -
 34
34 -
 35
35 -
 36
36 -
 37
37 -
 38
38 -
 39
39 -
 40
40 -
 41
41 -
 42
42 -
 43
43 -
 44
44 -
 45
45 -
 46
46 -
 47
47 -
 48
48 -
 49
49 -
 50
50 -
51
-
52
-
53
-
54
-
55
-
56
-
57
-
58
-
59
-
60
-
61
-
62
-
63
-
64
-
65
-
66
-
67
-
68
-
69
-
70
-
71
-
72
-
73
-
74
-
75
-
76
-
77
-
78
-
79
-
80
-
81
-
82
-
83
-
84
-
85
-
86
-
87
-
88
-
89
-
90
-
91
-
92
-
93
-
94
-
95
-
96
-
97
-
98
-
99
-
100
-
101
-
102
-
103
-
104
-
105
-
106
-
107
-
108
-
109
-
110
-
111
-
112
-
113
-
114
-
115
-
116
-
117
-
118
-
119
-
120
-
121
-
122
-
123
-
124
-
125
-
126
-
127
-
128
-
129
-
130
-
131
-
132
-
133
-
134
-
135
-
136
-
137
-
138
-
139
-
140
-
141
-
142
-
143
-
144
-
145
-
146
-
147
-
148
-
149
-
150
-
151
-
152
-
153
-
154
-
155
-
156
-
157
-
158
-
159
-
160
-
161
-
162
-
163
-
164
-
165
-
166
-
167
-
168
-
169
-
170
-
171
-
172
-
173
-
174
-
175
-
176
-
177
-
178
-
179
-
180
-
181
-
182
-
183
-
184
-
185
-
186
-
187
-
188
-
189
-
190
-
191
-
192
-
193
-
194
-
195
-
196
-
197
-
198
-
199
-
200
-
201
-
202
-
203
-
204
-
205
-
206
-
207
-
208
-
209
-
210
-
211
-
212
-
213
-
214
-
215
-
216
-
217
-
218
-
219
-
220
-
221
-
222
-
223
-
224
-
225
-
226
-
227
-
228
-
229
-
230
-
231
-
232
-
233
-
234
-
235
-
236
-
237
-
238
-
239
 |
 |

Table of Contents
are the tax effects of corporate income tax deductions (that are considered taxable income to the employee) that represent the amount
by which the fair value of our stock exceeds the option strike price on the day the employee exercises a stock option. The decline in
tax benefits in Fiscal 2008 and Fiscal 2007 from Fiscal 2006 is due to fewer stock option exercises.
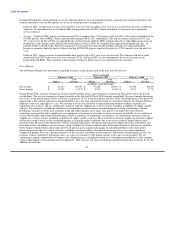
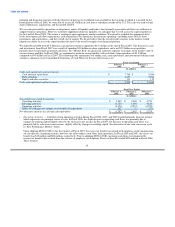
Key Performance Metrics — Our direct business model allows us to maintain an efficient asset management system in comparison to
our major competitors. We are capable of minimizing inventory risk while collecting amounts due from customers before paying
vendors, thus allowing us to generate annual cash flows from operating activities that typically exceed net income. The following
table presents the components of our cash conversion cycle for the fourth quarter of each of the past three fiscal years:
February 1, February 2, February 3,
2008 2007 2006
Days of sales outstanding(a) 36 31 29
Days of supply in inventory(b) 8 5 5
Days in accounts payable(c) (80) (78) (77)
Cash conversion cycle (36) (42) (43)
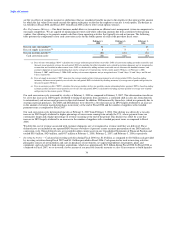
(a) Days of sales outstanding ("DSO") calculates the average collection period of our receivables. DSO is based on the ending net trade receivables and
the most recent quarterly revenue for each period. DSO also includes the effect of product costs related to customer shipments not yet recognized as
revenue that are classified in other current assets. DSO is calculated by adding accounts receivable, net of allowance for doubtful accounts, and
customer shipments in transit and dividing that sum by average net revenue per day for the current quarter (90 days). At February 1, 2008,
February 2, 2007, and February 3, 2006, DSO and days of customer shipments not yet recognized were 33 and 3 days, 28 and 3 days, and 26 and
3 days, respectively.
(b) Days of supply in inventory ("DSI") measures the average number of days from procurement to sale of our product. DSI is based on ending
inventory and most recent quarterly cost of sales for each period. DSI is calculated by dividing inventory by average cost of goods sold per day for
the current quarter (90 days).
(c) Days in accounts payable ("DPO") calculates the average number of days our payables remain outstanding before payment. DPO is based on ending
accounts payable and most recent quarterly cost of sales for each period. DPO is calculated by dividing accounts payable by average cost of goods
sold per day for the current quarter (90 days).
Our cash conversion cycle worsened by six days at February 1, 2008 as compared to February 2, 2007. This deterioration was driven
by a five day increase in DSO largely attributed to timing of payments from customers, a continued shift in sales mix from domestic
to international, and an increased presence in the retail channel. In addition, DSI increased by three days, which was primarily due to
strategic materials purchases. The DSO and DSI declines were offset by a two-day increase in DPO largely attributed to an increase
in the amount of strategic material purchases in inventory at the end of Fiscal 2008 and the number of suppliers with extended
payment terms as compared to Fiscal 2007.
Our cash conversion cycle deteriorated one day at February 2, 2007 from February 3, 2006. This decline was driven by a two-day
increase in DSO largely attributed to higher percentage of our revenue coming from outside the U.S., where payment terms are
customarily longer and a higher percentage of revenue occurring at the end of the period. This decline was offset by a one-day
increase in DPO largely attributed to an increase in the number of suppliers with extended payment terms as compared to Fiscal
2006.
We defer the cost of revenue associated with customer shipments not yet recognized as revenue until they are delivered. These
deferred costs are included in our reported DSO because we believe it presents a more accurate presentation of our DSO and cash
conversion cycle. These deferred costs are recorded in other current assets in our Consolidated Statements of Financial Position and
totaled $519 million, $424 million, and $417 million at February 1, 2008, February 2, 2007, and February 3, 2006, respectively.
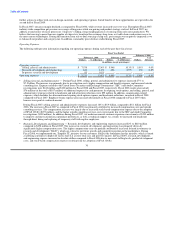
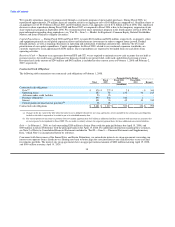
• Investing Activities — Cash used in investing activities during Fiscal 2008 was $1.8 billion, as compared to $1.0 billion cash provided
by investing activities during Fiscal 2007 and $4.1 billion provided in Fiscal 2006. Cash generated or used in investing activities
principally consists of net maturities and sales or purchases of investments; net capital expenditures for property, plant, and
equipment; and cash used to fund strategic acquisitions, which was approximately $2.2 billion during Fiscal 2008. In Fiscal 2008 as
compared to Fiscal 2007, we re-invested a lower amount of our proceeds from the maturity or sales of investments to build liquidity
36