Dell 2007 Annual Report Download - page 34
Download and view the complete annual report
Please find page 34 of the 2007 Dell annual report below. You can navigate through the pages in the report by either clicking on the pages listed below, or by using the keyword search tool below to find specific information within the annual report.-
 1
1 -
2
-
3
-
4
-
5
-
6
-
7
-
8
-
9
-
10
-
11
-
12
-
13
-
14
-
15
-
16
-
17
-
18
-
19
-
20
-
21
-
22
-
23
-
 24
24 -
 25
25 -
 26
26 -
 27
27 -
 28
28 -
 29
29 -
 30
30 -
 31
31 -
 32
32 -
 33
33 -
 34
34 -
 35
35 -
 36
36 -
 37
37 -
 38
38 -
 39
39 -
 40
40 -
 41
41 -
 42
42 -
 43
43 -
 44
44 -
45
-
46
-
47
-
48
-
49
-
50
-
51
-
52
-
53
-
54
-
55
-
56
-
57
-
58
-
59
-
60
-
61
-
62
-
63
-
64
-
65
-
66
-
67
-
68
-
69
-
70
-
71
-
72
-
73
-
74
-
75
-
76
-
77
-
78
-
79
-
80
-
81
-
82
-
83
-
84
-
85
-
86
-
87
-
88
-
89
-
90
-
91
-
92
-
93
-
94
-
95
-
96
-
97
-
98
-
99
-
100
-
101
-
102
-
103
-
104
-
105
-
106
-
107
-
108
-
109
-
110
-
111
-
112
-
113
-
114
-
115
-
116
-
117
-
118
-
119
-
120
-
121
-
122
-
123
-
124
-
125
-
126
-
127
-
128
-
129
-
130
-
131
-
132
-
133
-
134
-
135
-
136
-
137
-
138
-
139
-
140
-
141
-
142
-
143
-
144
-
145
-
146
-
147
-
148
-
149
-
150
-
151
-
152
-
153
-
154
-
155
-
156
-
157
-
158
-
159
-
160
-
161
-
162
-
163
-
164
-
165
-
166
-
167
-
168
-
169
-
170
-
171
-
172
-
173
-
174
-
175
-
176
-
177
-
178
-
179
-
180
-
181
-
182
-
183
-
184
-
185
-
186
-
187
-
188
-
189
-
190
-
191
-
192
-
193
-
194
-
195
-
196
-
197
-
198
-
199
-
200
-
201
-
202
-
203
-
204
-
205
-
206
-
207
-
208
-
209
-
210
-
211
-
212
-
213
-
214
-
215
-
216
-
217
-
218
-
219
-
220
-
221
-
222
-
223
-
224
-
225
-
226
-
227
-
228
-
229
-
230
-
231
-
232
-
233
-
234
-
235
-
236
-
237
-
238
-
239
 |
 |
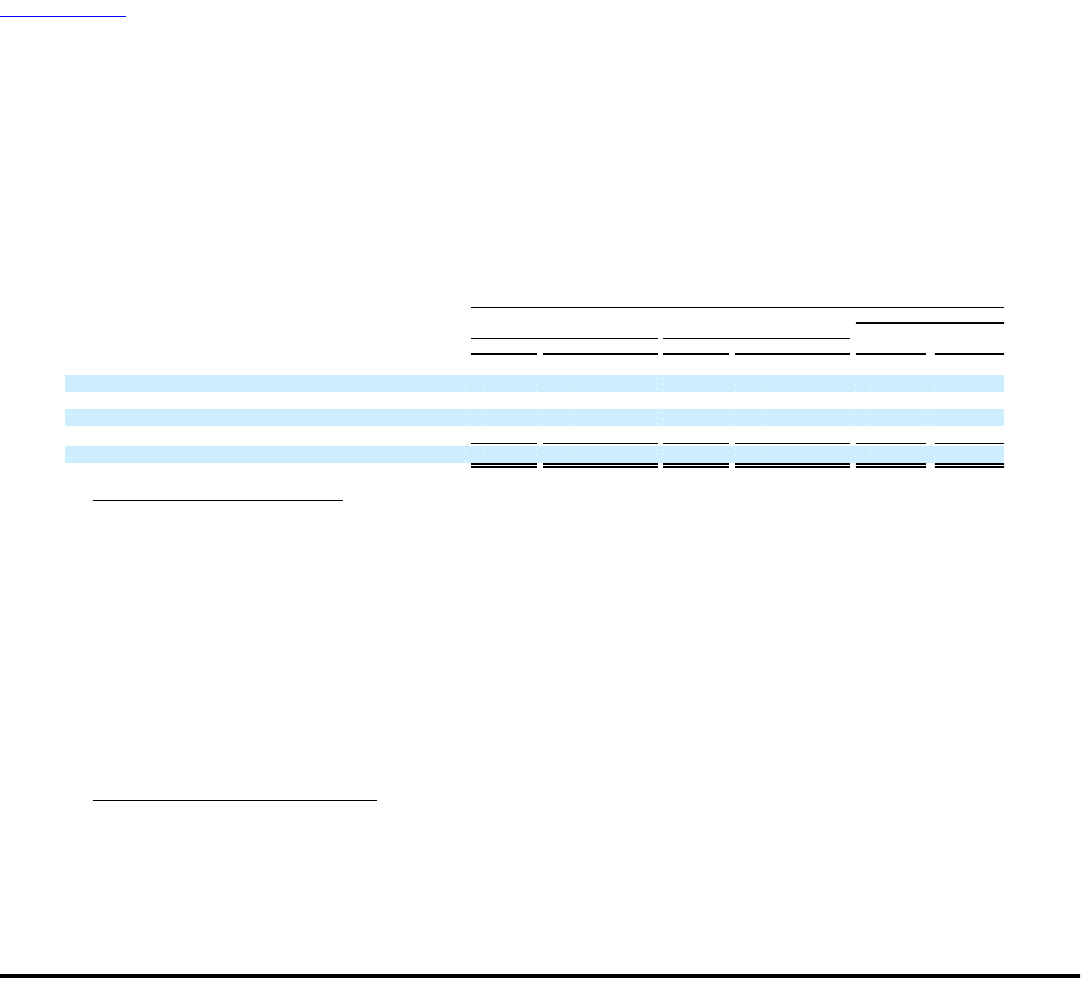
Table of Contents
further actions to reduce total costs in design, materials, and operating expenses. Initial benefits of these opportunities are expected in the
second half of Fiscal 2009.
In Fiscal 2007, our gross margin declined as compared to Fiscal 2006, while revenue increased year-over-year. Throughout Fiscal 2007,
industry-wide competition put pressure on average selling prices while our pricing and product strategy evolved. In Fiscal 2007, we
added a second source of micro processors ("chip sets") ending a long-standing practice of sourcing from only one manufacturer. We
believe that moving to more than one supplier of chip sets is beneficial for customers long-term, as it adds choice and ensures access to
the most current technologies. During the transition from sole to dual sourcing of chip sets, gross margin was negatively impacted as we
re-balanced our product and category mix. In addition, commodity price declines stalled during Fiscal 2007.
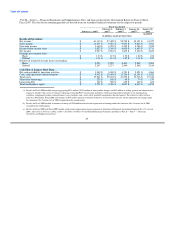
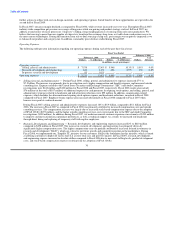
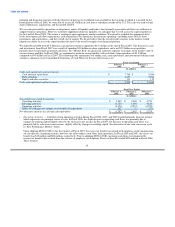
Operating Expenses
The following table presents information regarding our operating expenses during each of the past three fiscal years:
Fiscal Year Ended
February 3, 2006
February 1, 2008 February 2, 2007 % of
Dollars % of Revenue Dollars % of Revenue Dollars Revenue
(in millions, except percentages)
Operating expenses:
Selling, general, and administrative $ 7,538 12.4% $ 5,948 10.3% $ 5,051 9.0%
Research, development, and engineering 610 1.0% 498 0.9% 458 0.8%
In-process research and development 83 0.1% - - - -
Operating expenses $ 8,231 13.5% $ 6,446 11.2% $ 5,509 9.8%
• Selling, General, and Administrative — During Fiscal 2008, selling, general, and administrative expenses increased 27% to
$7.5 billion. The increase was primarily due to investigation costs, higher compensation and benefits expense, and increased outside
consulting fees. Expenses related to the United States Securities and Exchange Commission ("SEC") and Audit Committee
investigations were $160 million and $100 million for Fiscal 2008 and Fiscal 2007, respectively. Fiscal 2008 results also include
$76 million (of the total of $107 million) of additional expense for cash payments for expiring stock options, and selling, general, and
administrative expenses related to headcount and infrastructure reductions were $92 million. In addition, compensation related
expenses, which includes the aforementioned expiring stock options expense and headcount reductions, increased in Fiscal 2008
compared to Fiscal 2007. Employee bonus expense also increased substantially in Fiscal 2008 compared to Fiscal 2007 when
bonuses were paid at a reduced amount.
During Fiscal 2007, selling, general, and administrative expenses increased 18% to $5.9 billion, compared to $5.1 billion for Fiscal
2006. The increase in Fiscal 2007 as compared to Fiscal 2006 was primarily attributed to increased compensation costs and outside
consulting services. The compensation increase was largely due to increased stock-based compensation expense due to the adoption
of SFAS 123(R) ($272 million), and the higher outside consulting services costs were mainly due to the SEC and Audit Committee
investigations ($100 million). In addition, during Fiscal 2007, we made incremental customer experience investments of $150 million
to improve customer satisfaction, repurchase preferences, as well as technical support. As a result, we increased our headcount
through direct hiring and replacing of temporary staff with regular employees.
• Research, Development, and Engineering — Research, development, and engineering expenses increased 22% to $610 million
compared to $498 million in Fiscal 2007. The increase in research, development, and engineering was primarily driven by
significantly higher compensation costs. The higher compensation costs are partially attributed to increased focused investments in
research and development ("R&D"), which are critical to our future growth and competitive position in the marketplace. During
Fiscal 2008, we implemented our "Simplify IT" initiative for our customers. R&D is the foundation for this initiative, which is aimed
at allowing customers to deploy IT faster, run IT at a lower total cost, and grow IT smarter. In Fiscal 2007, research, development,
and engineering expense increased in absolute dollars compared to Fiscal 2006 due to increased staffing levels, product development
costs, and stock-based compensation expense resulting from the adoption of SFAS 123(R).
30