Dell 2007 Annual Report Download - page 29
Download and view the complete annual report
Please find page 29 of the 2007 Dell annual report below. You can navigate through the pages in the report by either clicking on the pages listed below, or by using the keyword search tool below to find specific information within the annual report.
Table of Contents
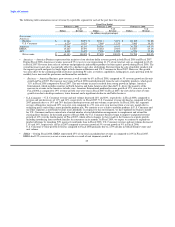
The following table summarizes our net revenue by reportable segment for each of the past three fiscal years:
Fiscal Year Ended
February 1, 2008 February 2, 2007 February 3, 2006
% of % of % of
Dollars Revenue Dollars Revenue Dollars Revenue
(in millions, except percentages)
Net revenue
Americas:
Business $ 31,144 50.9% $ 29,311 51.1% $ 28,365 50.8%
U.S. Consumer 6,224 10.2% 7,069 12.3% 7,960 14.3%
Americas 37,368 61.1% 36,380 63.4% 36,325 65.1%
EMEA 15,267 25.0% 13,682 23.8% 12,887 23.1%
APJ 8,498 13.9% 7,358 12.8% 6,576 11.8%
Net revenue $ 61,133 100.0% $ 57,420 100.0% $ 55,788 100.0%
• Americas — Americas Business represented the majority of our absolute dollar revenue growth in both Fiscal 2008 and Fiscal 2007.
During Fiscal 2008, Americas revenues increased 3% year-over-year representing 61.1% of our total net sales as compared to 63.4%
in Fiscal 2007. Revenue from sales of software and peripherals and mobility products led the region's growth during Fiscal 2008. The
overall increase in net sales was partially offset by a decline in net sales of desktops. Revenue from the sale of mobility products led
the region's growth and grew by single digits in both Americas Business and U.S. Consumer in Fiscal 2007. However, this growth
was also offset by the continuing trend of declines in desktop PC sales as wireless capabilities, falling prices, and a growing need for
mobility have increased the preference and demand for notebooks.
– Business — Americas Business grew revenue as well as units by 6% in Fiscal 2008, compared to 3% revenue growth on flat unit
growth in Fiscal 2007. The increase in revenue in Fiscal 2008 resulted primarily from the sale of mobility products, which grew
11% in Fiscal 2008 compared to Fiscal 2007. The unit volume increases resulted from strong growth in laptops. Americas
International, which includes countries in North America and Latin America other than the U.S., drove the majority of the
increase in revenue in the Americas in both years. Americas International produced revenue growth of 17% year-over-year for
Fiscal 2008 as compared to 19% revenue growth year-over-year in Fiscal 2007. In Fiscal 2007, the slow down of net revenue
growth was due to desktop weakness, lower demand, and a significant decline in our Public business.
– U.S. Consumer — U.S. Consumer revenue and unit volume decreased 12% and 20%, respectively, in Fiscal 2008, compared to
revenue and unit decreases of 11% and 14%, respectively, in Fiscal 2007. U.S. Consumer revenue declined as compared to Fiscal
2007 primarily due to a 19% and 29% decline in desktop revenue and unit volume, respectively. In Fiscal 2008, this segment's
average selling price increased 10% year-over-year compared to a 3% year-over-year increase from a year ago, mainly due to
realigning prices and selling a more profitable product mix. We continue to see a shift to mobility products in U.S. Consumer and
our other segments as notebooks become more affordable. In response to this environment, we have updated our business model
for U.S. Consumer and have entered into a limited number of retail distribution arrangements to complement and extend the
existing direct business. In the fourth quarter of Fiscal 2008, the U.S. Consumer business began to improve and posted revenue
growth of 12% over the fourth quarter of Fiscal 2007, which reflects changes we have made to the business to reignite growth,
including introducing four notebook families for consumers in six months. In Fiscal 2009, we expect to continue to expand our
product offerings by launching 50% more new notebooks than in Fiscal 2008. U.S. Consumer revenue and unit volume decreased
11% and 14%, respectively, in Fiscal 2007 compared to revenue growth of 5% on unit growth of 9% in Fiscal 2006.
U.S. Consumer revenue growth slowed as compared to Fiscal 2006 primarily due to a 25% decline in both desktop revenue and
unit volume.
• EMEA — During Fiscal 2008, EMEA represented 25% of our total consolidated net revenue as compared to 24% in Fiscal 2007.
EMEA had 12% year-over-year net revenue growth as a result of unit shipment growth of
25


