Dell 2007 Annual Report Download - page 36
Download and view the complete annual report
Please find page 36 of the 2007 Dell annual report below. You can navigate through the pages in the report by either clicking on the pages listed below, or by using the keyword search tool below to find specific information within the annual report.-
 1
1 -
2
-
3
-
4
-
5
-
6
-
7
-
8
-
9
-
10
-
11
-
12
-
13
-
14
-
15
-
16
-
17
-
18
-
19
-
20
-
21
-
22
-
23
-
24
-
25
-
 26
26 -
 27
27 -
 28
28 -
 29
29 -
 30
30 -
 31
31 -
 32
32 -
 33
33 -
 34
34 -
 35
35 -
 36
36 -
 37
37 -
 38
38 -
 39
39 -
 40
40 -
 41
41 -
 42
42 -
 43
43 -
 44
44 -
 45
45 -
 46
46 -
47
-
48
-
49
-
50
-
51
-
52
-
53
-
54
-
55
-
56
-
57
-
58
-
59
-
60
-
61
-
62
-
63
-
64
-
65
-
66
-
67
-
68
-
69
-
70
-
71
-
72
-
73
-
74
-
75
-
76
-
77
-
78
-
79
-
80
-
81
-
82
-
83
-
84
-
85
-
86
-
87
-
88
-
89
-
90
-
91
-
92
-
93
-
94
-
95
-
96
-
97
-
98
-
99
-
100
-
101
-
102
-
103
-
104
-
105
-
106
-
107
-
108
-
109
-
110
-
111
-
112
-
113
-
114
-
115
-
116
-
117
-
118
-
119
-
120
-
121
-
122
-
123
-
124
-
125
-
126
-
127
-
128
-
129
-
130
-
131
-
132
-
133
-
134
-
135
-
136
-
137
-
138
-
139
-
140
-
141
-
142
-
143
-
144
-
145
-
146
-
147
-
148
-
149
-
150
-
151
-
152
-
153
-
154
-
155
-
156
-
157
-
158
-
159
-
160
-
161
-
162
-
163
-
164
-
165
-
166
-
167
-
168
-
169
-
170
-
171
-
172
-
173
-
174
-
175
-
176
-
177
-
178
-
179
-
180
-
181
-
182
-
183
-
184
-
185
-
186
-
187
-
188
-
189
-
190
-
191
-
192
-
193
-
194
-
195
-
196
-
197
-
198
-
199
-
200
-
201
-
202
-
203
-
204
-
205
-
206
-
207
-
208
-
209
-
210
-
211
-
212
-
213
-
214
-
215
-
216
-
217
-
218
-
219
-
220
-
221
-
222
-
223
-
224
-
225
-
226
-
227
-
228
-
229
-
230
-
231
-
232
-
233
-
234
-
235
-
236
-
237
-
238
-
239
 |
 |

Table of Contents
exercise of employee stock options by employees and the vesting of restricted stock units. As options have again become exercisable, we
do not expect to pay cash for expired in-the-money stock options in the future.
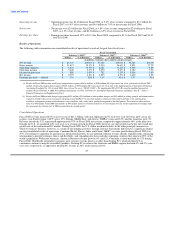
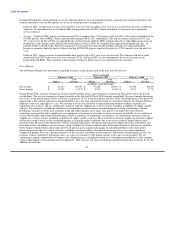
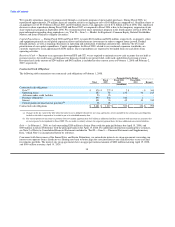
Investment and Other Income, net
The table below provides a detailed presentation of investment and other income, net for Fiscal 2008, 2007, and 2006.
Fiscal Year Ended
February 1, February 2, February 3,
2008 2007 2006
(in millions)
Investment and other income, net:
Investment income, primarily interest $ 496 $ 368 $ 308
Gains (losses) on investments, net 14 (5) (2)
Interest expense (45) (45) (29)
CIT minority interest (29) (23) (27)
Foreign exchange (30) (37) 3
Gain on sale of building - 36 -
Other (19) (19) (27)
Investment and other income, net $ 387 $ 275 $ 226
The increase in investment income from Fiscal 2007 to Fiscal 2008 is primarily due to earnings on higher average balances of cash
equivalents and investments, partially offset by lower interest rates. In Fiscal 2007, investment income increased from the prior year
primarily due to rising interest rates, partially offset by a decrease in interest income earned on lower average balances of cash
equivalents and investments. The gains in Fiscal 2008 as compared to losses in Fiscal 2007 and Fiscal 2006 are mainly the result of sales
of securities. The increase from Fiscal 2006 to Fiscal 2007 in interest expense is due to an increase in the effective rate on the debt swap
agreements and the start of the commercial paper program in Fiscal 2007. The increase in foreign exchange loss in Fiscal 2008 and Fiscal
2007 relative to Fiscal 2006 is mainly due to higher net losses on derivative instruments. The gain on sale of building relates to the sale of
a building in EMEA.
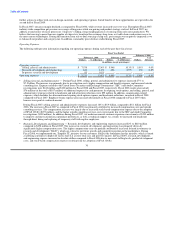
Income Taxes
Our effective tax rate was 23.0%, 22.8%, and 21.8% for Fiscal 2008, 2007, and 2006, respectively. The differences between our effective
tax rate and the U.S. federal statutory rate of 35% principally result from our geographical distribution of taxable income and permanent
differences between the book and tax treatment of certain items. We reported an effective tax rate of approximately 23.0% for Fiscal
2008, as compared to 22.8% for Fiscal 2007. In the fourth quarter of Fiscal 2008, we were able to access $5.3 billion in cash from a
subsidiary outside of the U.S. to fund share repurchases, acquisitions, and the continued growth of DFS. Accessing the cash slightly
increased our effective tax rate. The taxes related to accessing the foreign cash and nondeductibility of the in-process research and
development acquisition charges were offset primarily by the increase of our consolidated profitability in lower tax rate jurisdictions
during Fiscal 2008. For Fiscal 2007, we reported an effective tax rate of approximately 22.8%, as compared to 21.8% for Fiscal 2006.
The increase in our Fiscal 2007 effective tax rate compared to Fiscal 2006 is due to the $85 million tax reduction in the second quarter of
Fiscal 2006 discussed below, offset by a higher proportion of our operating profits being generated in lower foreign tax jurisdictions
during Fiscal 2007. Our foreign earnings are generally taxed at lower rates than in the United States. As a result, sales growth and related
profit earned outside of the U.S. in lower tax jurisdictions is expected to lower our operational effective tax rate in future periods.
We adopted Financial Accounting Standards Board (FASB) Interpretation No. 48, Accounting for Uncertainty in Income Taxes — an
Interpretation of FASB Statement No. 109 ("FIN 48") effective February 3, 2007. FIN 48 clarifies the accounting and reporting for
uncertainties in income taxes recognized in our financial statements in accordance with SFAS No. 109, Accounting for Income Taxes
("SFAS 109"). FIN 48 prescribes a comprehensive model for the financial statement recognition, measurement, presentation, and
disclosure of uncertain tax positions
32