Dell 2007 Annual Report Download - page 32
Download and view the complete annual report
Please find page 32 of the 2007 Dell annual report below. You can navigate through the pages in the report by either clicking on the pages listed below, or by using the keyword search tool below to find specific information within the annual report.-
 1
1 -
2
-
3
-
4
-
5
-
6
-
7
-
8
-
9
-
10
-
11
-
12
-
13
-
14
-
15
-
16
-
17
-
18
-
19
-
20
-
21
-
 22
22 -
 23
23 -
 24
24 -
 25
25 -
 26
26 -
 27
27 -
 28
28 -
 29
29 -
 30
30 -
 31
31 -
 32
32 -
 33
33 -
 34
34 -
 35
35 -
 36
36 -
 37
37 -
 38
38 -
 39
39 -
 40
40 -
 41
41 -
 42
42 -
43
-
44
-
45
-
46
-
47
-
48
-
49
-
50
-
51
-
52
-
53
-
54
-
55
-
56
-
57
-
58
-
59
-
60
-
61
-
62
-
63
-
64
-
65
-
66
-
67
-
68
-
69
-
70
-
71
-
72
-
73
-
74
-
75
-
76
-
77
-
78
-
79
-
80
-
81
-
82
-
83
-
84
-
85
-
86
-
87
-
88
-
89
-
90
-
91
-
92
-
93
-
94
-
95
-
96
-
97
-
98
-
99
-
100
-
101
-
102
-
103
-
104
-
105
-
106
-
107
-
108
-
109
-
110
-
111
-
112
-
113
-
114
-
115
-
116
-
117
-
118
-
119
-
120
-
121
-
122
-
123
-
124
-
125
-
126
-
127
-
128
-
129
-
130
-
131
-
132
-
133
-
134
-
135
-
136
-
137
-
138
-
139
-
140
-
141
-
142
-
143
-
144
-
145
-
146
-
147
-
148
-
149
-
150
-
151
-
152
-
153
-
154
-
155
-
156
-
157
-
158
-
159
-
160
-
161
-
162
-
163
-
164
-
165
-
166
-
167
-
168
-
169
-
170
-
171
-
172
-
173
-
174
-
175
-
176
-
177
-
178
-
179
-
180
-
181
-
182
-
183
-
184
-
185
-
186
-
187
-
188
-
189
-
190
-
191
-
192
-
193
-
194
-
195
-
196
-
197
-
198
-
199
-
200
-
201
-
202
-
203
-
204
-
205
-
206
-
207
-
208
-
209
-
210
-
211
-
212
-
213
-
214
-
215
-
216
-
217
-
218
-
219
-
220
-
221
-
222
-
223
-
224
-
225
-
226
-
227
-
228
-
229
-
230
-
231
-
232
-
233
-
234
-
235
-
236
-
237
-
238
-
239
 |
 |

Table of Contents
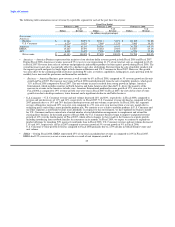
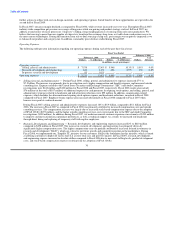
products become standardized, demand for our mobility products continues to be strong, producing robust year-over-year revenue
and unit growth. We are likely to see sustained growth in our mobility products in the foreseeable future due to the continued
industry-wide migration from desktop PCs to mobility products.
In Fiscal 2007, revenue from mobility products grew by 8% year-over-year as compared to 20% in the previous year. The impact of
the diminished growth was particularly acute in the U.S. and led to a loss of share as compared to Fiscal 2006. The slow growth
resulted from both our product feature set and related value offering, particularly in the consumer business, as well as our inability to
reach certain customer sets. Our EMEA region led the growth in our mobility product category with a 15% increase in Fiscal 2007.
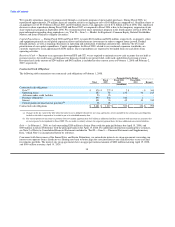
• Software and Peripherals — In Fiscal 2008, revenue from software and peripherals ("S&P") (which includes Dell-branded printers,
monitors not sold with systems, plasma and LCD televisions, projectors, and a multitude of competitively priced third-party printers,
televisions, software, digital cameras, and other products) increased 10% year-over-year. EMEA lead S&P revenue growth with a
year-over-year increase of 14%, and Americas Business and APJ revenue growth was 11% and 10%, respectively, during Fiscal 2008
as compared to Fiscal 2007. The increase in S&P revenue is primarily attributable to strength in imaging and printing, digital
displays, and software licensing. With the acquisition of ASAP, a leading software solutions and licensing services provider, in the
fourth quarter of Fiscal 2008, we now offer products from over 2,000 software publishers.
In Fiscal 2007, revenue from software and peripherals increased 8% year-over-year. The overall increase in Fiscal 2007 S&P revenue
was led by the APJ region with growth of 38%, while U.S. consumer sales declined 8%. This increase was primarily attributable to a
12% year-over-year increase in software revenue that was offset by declines in our imaging product revenue.
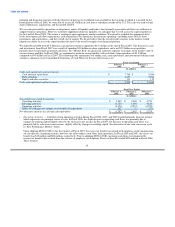
• Servers and Networking — In Fiscal 2008, servers and networking revenue grew 12% on unit growth of 6% year-over-year as
compared to industry unit growth of 8%. Our unit growth was slightly behind the growth in the overall industry, while we improved
our product feature sets by transitioning to new platforms, and as we managed through the realignment of certain portions of our sales
force to address sales execution deficiencies. A significant portion of the revenue growth is due to higher average selling prices,
which increased 5% during Fiscal 2008 as compared to the prior year. Fourth quarter year-over-year revenue growth of 2% was
below industry growth and our expectations as conservatism in the U.S. commercial sectors affected sales of our server products. All
regions experienced strong year-over-year revenue growth with APJ leading the way with 20% growth on unit growth of 5%;
additionally, server and networking revenue increased 16% and 8% in EMEA and the Americas, respectively. For Fiscal 2008, we
were again ranked number one in the United States with a 34% share in server units shipped; worldwide we were second with a 25%
share. Servers and networking remains a strategic focus area. Late in the fourth quarter, we launched our 10G blade servers — the
most energy efficient blade server solution on the market. Our PowerEdge servers are ranked number one in server benchmark testing
for overall performance, energy efficiency, and price.
In Fiscal 2007, servers and networking revenue grew 7% on unit growth of 6% year-over-year. During Fiscal 2007 we introduced our
new ninth generation (9G) PowerEdge servers with Intel's Xeon 5100 series processors, and we began shipping two new PowerEdge
servers featuring AMD OpteronTM processors, providing our customers with an additional choice for high-performance two-socket
and four-socket systems. We also launched the industry's first standards-based Quad-Core processors for two-socket blade, rack, and
tower servers. These additions contributed to the 6% year-over-year revenue increase in Fiscal 2007 in the Americas Business
segment.
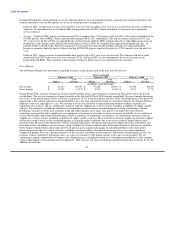
• Services — In Fiscal 2008, revenue from services (which includes the sale and servicing of our extended product warranties)
increased 5% year-over-year compared to a 20% increase in Fiscal 2007. EMEA drove services revenue growth with a 30% increase
in Fiscal 2008 as compared to Fiscal 2007, and Americas Business contributed with 3% revenue growth. This growth was offset by
revenue declines in U.S. Consumer and APJ of 16% and 10%, respectively. Strong Fiscal 2008 services sales increased our deferred
service revenue balance by approximately $1.0 billion in Fiscal 2008, a 25% increase to approximately $5.3 billion. In Fiscal 2007,
our deferred service revenue increased $514 million or 14% to approximately $4.2 billion. During Fiscal 2008, we acquired a number
of service technologies and capabilities through strategic acquisitions of certain companies. These capabilities are being used to
build-out our mix of service offerings. In the first quarter of Fiscal 2009, we
28