Dell 2007 Annual Report Download - page 23
Download and view the complete annual report
Please find page 23 of the 2007 Dell annual report below. You can navigate through the pages in the report by either clicking on the pages listed below, or by using the keyword search tool below to find specific information within the annual report.-
 1
1 -
2
-
3
-
4
-
5
-
6
-
7
-
8
-
9
-
10
-
11
-
12
-
 13
13 -
 14
14 -
 15
15 -
 16
16 -
 17
17 -
 18
18 -
 19
19 -
 20
20 -
 21
21 -
 22
22 -
 23
23 -
 24
24 -
 25
25 -
 26
26 -
 27
27 -
 28
28 -
 29
29 -
 30
30 -
 31
31 -
 32
32 -
 33
33 -
34
-
35
-
36
-
37
-
38
-
39
-
40
-
41
-
42
-
43
-
44
-
45
-
46
-
47
-
48
-
49
-
50
-
51
-
52
-
53
-
54
-
55
-
56
-
57
-
58
-
59
-
60
-
61
-
62
-
63
-
64
-
65
-
66
-
67
-
68
-
69
-
70
-
71
-
72
-
73
-
74
-
75
-
76
-
77
-
78
-
79
-
80
-
81
-
82
-
83
-
84
-
85
-
86
-
87
-
88
-
89
-
90
-
91
-
92
-
93
-
94
-
95
-
96
-
97
-
98
-
99
-
100
-
101
-
102
-
103
-
104
-
105
-
106
-
107
-
108
-
109
-
110
-
111
-
112
-
113
-
114
-
115
-
116
-
117
-
118
-
119
-
120
-
121
-
122
-
123
-
124
-
125
-
126
-
127
-
128
-
129
-
130
-
131
-
132
-
133
-
134
-
135
-
136
-
137
-
138
-
139
-
140
-
141
-
142
-
143
-
144
-
145
-
146
-
147
-
148
-
149
-
150
-
151
-
152
-
153
-
154
-
155
-
156
-
157
-
158
-
159
-
160
-
161
-
162
-
163
-
164
-
165
-
166
-
167
-
168
-
169
-
170
-
171
-
172
-
173
-
174
-
175
-
176
-
177
-
178
-
179
-
180
-
181
-
182
-
183
-
184
-
185
-
186
-
187
-
188
-
189
-
190
-
191
-
192
-
193
-
194
-
195
-
196
-
197
-
198
-
199
-
200
-
201
-
202
-
203
-
204
-
205
-
206
-
207
-
208
-
209
-
210
-
211
-
212
-
213
-
214
-
215
-
216
-
217
-
218
-
219
-
220
-
221
-
222
-
223
-
224
-
225
-
226
-
227
-
228
-
229
-
230
-
231
-
232
-
233
-
234
-
235
-
236
-
237
-
238
-
239
 |
 |
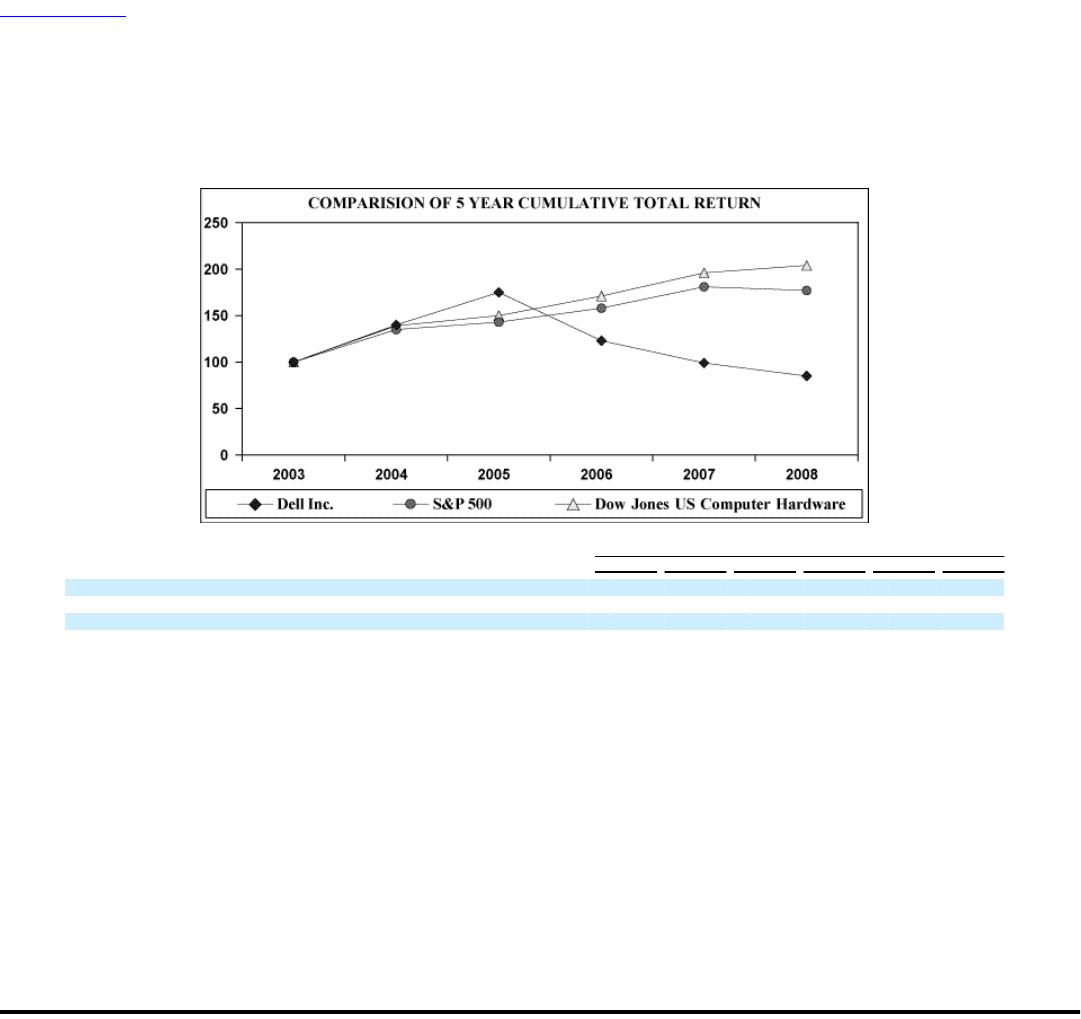
Table of Contents
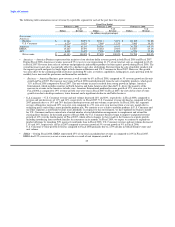
Stock Performance Graph
The following graph compares the cumulative total return on Dell's common stock during the last five fiscal years with the S&P 500
Index and the Dow Jones Computer Index during the same period. The graph shows the value, at the end of each of the last five fiscal
years, of $100 invested in Dell common stock or the indices on February 1, 2003, and assumes the reinvestment of all dividends. The
graph depicts the change in the value of common stock relative to the indices at the end of each fiscal year and not for any interim period.
Historical stock price performance is not necessarily indicative of future stock price performance.
End of Fiscal Year
2003 2004 2005 2006 2007 2008
Dell Inc. $ 100 $ 140 $ 172 $ 123 $ 99 $ 85
S&P 500 Index 100 135 143 158 181 177
Dow Jones US Computer Hardware Index 100 139 150 171 196 204
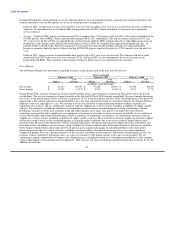
ITEM 6 — SELECTED FINANCIAL DATA
The following selected financial data should be read in conjunction with "Part II — Item 7 — Management's Discussion and Analysis of
Financial Condition and Results of Operations" and "Part II — Item 8 — Financial Statements and Supplementary Data."
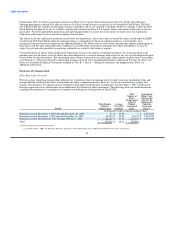
The Audit Committee of our Board of Directors completed an independent investigation into certain accounting and financial reporting
matters during Fiscal 2008. As a result of issues identified during the investigation, and during additional reviews and procedures
conducted by management, the Audit Committee, in consultation with management and PricewaterhouseCoopers LLP, our independent
registered public accounting firm, concluded on August 13, 2007 that our previously issued financial statements for Fiscal 2003, 2004,
2005, and 2006 (including the interim periods within those years), and the first quarter of Fiscal 2007, should no longer be relied upon
because of certain accounting errors and irregularities in those financial statements. Accordingly, we restated our previously issued
financial statements for those periods. Restated financial information is presented in our Annual Report on Form 10-K for Fiscal 2007
and is reflected in this report. That document also contains a discussion of the investigation, the accounting errors and irregularities
identified, and the adjustments made as a result of the restatement.
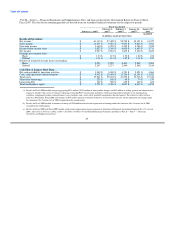
The following balance sheet data as of February 1, 2008, February 2, 2007, and February 3, 2006, and results of operations for Fiscal
2008, 2007, 2006, and 2005 are derived from our audited financial statements included in
19