Dell 2007 Annual Report Download - page 37
Download and view the complete annual report
Please find page 37 of the 2007 Dell annual report below. You can navigate through the pages in the report by either clicking on the pages listed below, or by using the keyword search tool below to find specific information within the annual report.-
 1
1 -
2
-
3
-
4
-
5
-
6
-
7
-
8
-
9
-
10
-
11
-
12
-
13
-
14
-
15
-
16
-
17
-
18
-
19
-
20
-
21
-
22
-
23
-
24
-
25
-
26
-
 27
27 -
 28
28 -
 29
29 -
 30
30 -
 31
31 -
 32
32 -
 33
33 -
 34
34 -
 35
35 -
 36
36 -
 37
37 -
 38
38 -
 39
39 -
 40
40 -
 41
41 -
 42
42 -
 43
43 -
 44
44 -
 45
45 -
 46
46 -
 47
47 -
48
-
49
-
50
-
51
-
52
-
53
-
54
-
55
-
56
-
57
-
58
-
59
-
60
-
61
-
62
-
63
-
64
-
65
-
66
-
67
-
68
-
69
-
70
-
71
-
72
-
73
-
74
-
75
-
76
-
77
-
78
-
79
-
80
-
81
-
82
-
83
-
84
-
85
-
86
-
87
-
88
-
89
-
90
-
91
-
92
-
93
-
94
-
95
-
96
-
97
-
98
-
99
-
100
-
101
-
102
-
103
-
104
-
105
-
106
-
107
-
108
-
109
-
110
-
111
-
112
-
113
-
114
-
115
-
116
-
117
-
118
-
119
-
120
-
121
-
122
-
123
-
124
-
125
-
126
-
127
-
128
-
129
-
130
-
131
-
132
-
133
-
134
-
135
-
136
-
137
-
138
-
139
-
140
-
141
-
142
-
143
-
144
-
145
-
146
-
147
-
148
-
149
-
150
-
151
-
152
-
153
-
154
-
155
-
156
-
157
-
158
-
159
-
160
-
161
-
162
-
163
-
164
-
165
-
166
-
167
-
168
-
169
-
170
-
171
-
172
-
173
-
174
-
175
-
176
-
177
-
178
-
179
-
180
-
181
-
182
-
183
-
184
-
185
-
186
-
187
-
188
-
189
-
190
-
191
-
192
-
193
-
194
-
195
-
196
-
197
-
198
-
199
-
200
-
201
-
202
-
203
-
204
-
205
-
206
-
207
-
208
-
209
-
210
-
211
-
212
-
213
-
214
-
215
-
216
-
217
-
218
-
219
-
220
-
221
-
222
-
223
-
224
-
225
-
226
-
227
-
228
-
229
-
230
-
231
-
232
-
233
-
234
-
235
-
236
-
237
-
238
-
239
 |
 |

Table of Contents
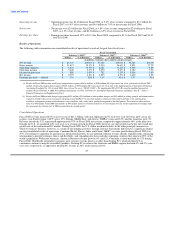
taken or expected to be taken in income tax returns. The adoption of FIN 48 resulted in a decrease to stockholders' equity of
approximately $62 million in the first quarter of Fiscal 2008. For a further discussion of the impact of FIN 48, see Note 3 of Notes to
Consolidated Financial Statements included in "Part II — Item 8 — Financial Statements and Supplementary Data."
On October 22, 2004, the American Jobs Creation Act of 2004 was signed into law. Among other items, that act created a temporary
incentive for U.S. multinationals to repatriate accumulated income earned outside the U.S. at an effective tax rate of 5.25%, versus the
U.S. federal statutory rate of 35%. In the fourth quarter of Fiscal 2005, we recorded an initial estimated income tax charge of
$280 million based on the decision to repatriate $4.1 billion of foreign earnings. This tax charge included an amount relating to a drafting
oversight that Congressional leaders expected to correct in calendar year 2005. On May 10, 2005, the Department of Treasury issued
further guidance that addressed the drafting oversight. In the second quarter of Fiscal 2006, we reduced our original estimate of the tax
charge by $85 million as a result of the guidance issued by the Treasury Department. At February 3, 2006, we had completed the
repatriation of the $4.1 billion in foreign earnings
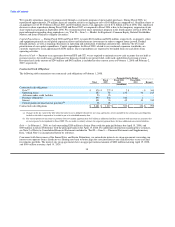
Financing Receivables and Off-Balance Sheet Arrangements
Financing Receivables — At February 1, 2008, our financing receivables balance was $2.1 billion of which $1.6 billion represents
customer receivables. Customer receivables increased 16% from our balance at February 2, 2007. This increase primarily reflects our
contractual right to fund a greater percentage of customer receivables as CIT's funding rights decrease. As our funding rights increase, we
expect continued growth in customer financing receivables, subject to the outcome of the strategic review noted below. To manage this
growth, we will continue to balance the use of our own working capital and other sources of liquidity. The key decision factors in the
analysis are the cost of funds, required credit enhancements, and the ability to access the capital markets. Of the customer receivables
balance, $444 million represented balances which were due from CIT in connection with specified promotional programs. Given the
recent volatility in the credit markets, we are closely monitoring all of our financing receivables and are actively pursuing alternative
strategies to mitigate any potential balance sheet risk. Based on our assessment of these customer financing receivables and the associated
risks, we believe that we are adequately reserved. See Note 6 of Notes to Consolidated Financial Statements included in "Part II — Item 8
— Financial Statements and Supplementary Data" for additional information about our financing receivables and our promotional
programs.
We closely monitor credit risk of our entire portfolio. Our investment in credit risk management resources and tools allow us to
constantly evaluate our portfolio credit risk. During Fiscal 2008, we took underwriting actions, including reducing our credit approval
rate of subprime customers, in order to protect our portfolio from the deteriorating credit environment. We will continue to assess our
portfolio risk and take additional underwriting actions, as we deem necessary. Subprime consumer receivables comprise less than 20% of
the net customer financing receivables balance at February 1, 2008.
We maintain an allowance for losses to cover probable financing receivable credit losses. The allowance for losses is determined based
on various factors, including historical experience, past due receivables, receivable type, and customer risk profile. Substantial changes in
the economic environment or any of the factors mentioned above could change the expectation of anticipated credit losses. As of
February 1, 2008 and February 2, 2007, the allowance for financing receivable losses was $96 million and $39 million, respectively. A
10% change in this allowance would not be material to our consolidated results. See Note 6 of Notes to Consolidated Financial
Statements included in "Part II — Item 8 — Financial Statements and Supplementary Data" for additional information.
We announced on March 31, 2008, that we are undertaking a strategic assessment of ownership alternatives for DFS financing activities.
The assessment will primarily focus on the consumer and small-and-medium business revolving credit financing receivables and
operations in the U.S., but may also include commercial leasing. The outcome of the assessment will depend on the customer, capital, and
economic impact of alternative ownership structures. It is possible the assessment will result in no change to the ownership and/or
operating structure. We expect to complete our assessment in the third quarter of Fiscal 2009.
Asset Securitization — During Fiscal 2008, we continued to sell customer financing receivables to unconsolidated qualifying special
purpose entities. The qualifying special purpose entities are bankruptcy remote legal entities with
33