Dell 2007 Annual Report Download - page 39
Download and view the complete annual report
Please find page 39 of the 2007 Dell annual report below. You can navigate through the pages in the report by either clicking on the pages listed below, or by using the keyword search tool below to find specific information within the annual report.-
 1
1 -
2
-
3
-
4
-
5
-
6
-
7
-
8
-
9
-
10
-
11
-
12
-
13
-
14
-
15
-
16
-
17
-
18
-
19
-
20
-
21
-
22
-
23
-
24
-
25
-
26
-
27
-
28
-
 29
29 -
 30
30 -
 31
31 -
 32
32 -
 33
33 -
 34
34 -
 35
35 -
 36
36 -
 37
37 -
 38
38 -
 39
39 -
 40
40 -
 41
41 -
 42
42 -
 43
43 -
 44
44 -
 45
45 -
 46
46 -
 47
47 -
 48
48 -
 49
49 -
50
-
51
-
52
-
53
-
54
-
55
-
56
-
57
-
58
-
59
-
60
-
61
-
62
-
63
-
64
-
65
-
66
-
67
-
68
-
69
-
70
-
71
-
72
-
73
-
74
-
75
-
76
-
77
-
78
-
79
-
80
-
81
-
82
-
83
-
84
-
85
-
86
-
87
-
88
-
89
-
90
-
91
-
92
-
93
-
94
-
95
-
96
-
97
-
98
-
99
-
100
-
101
-
102
-
103
-
104
-
105
-
106
-
107
-
108
-
109
-
110
-
111
-
112
-
113
-
114
-
115
-
116
-
117
-
118
-
119
-
120
-
121
-
122
-
123
-
124
-
125
-
126
-
127
-
128
-
129
-
130
-
131
-
132
-
133
-
134
-
135
-
136
-
137
-
138
-
139
-
140
-
141
-
142
-
143
-
144
-
145
-
146
-
147
-
148
-
149
-
150
-
151
-
152
-
153
-
154
-
155
-
156
-
157
-
158
-
159
-
160
-
161
-
162
-
163
-
164
-
165
-
166
-
167
-
168
-
169
-
170
-
171
-
172
-
173
-
174
-
175
-
176
-
177
-
178
-
179
-
180
-
181
-
182
-
183
-
184
-
185
-
186
-
187
-
188
-
189
-
190
-
191
-
192
-
193
-
194
-
195
-
196
-
197
-
198
-
199
-
200
-
201
-
202
-
203
-
204
-
205
-
206
-
207
-
208
-
209
-
210
-
211
-
212
-
213
-
214
-
215
-
216
-
217
-
218
-
219
-
220
-
221
-
222
-
223
-
224
-
225
-
226
-
227
-
228
-
229
-
230
-
231
-
232
-
233
-
234
-
235
-
236
-
237
-
238
-
239
 |
 |

Table of Contents
planning and financing strategies with the objective of having our worldwide cash available in the locations in which it is needed. In the
fourth quarter of Fiscal 2008, we were able to access $5.3 billion in cash from a subsidiary outside of the U.S. The cash was used to fund
shares repurchases, acquisitions, and the growth of DFS.
We use cash generated by operations as our primary source of liquidity and believe that internally generated cash flows are sufficient to
support business operations. However, to further supplement domestic liquidity, we anticipate that we will access the capital markets in
the first half of Fiscal 2009. This action is contingent upon appropriate market conditions. We intend to establish the appropriate debt
levels based upon cash flow expectations, cash requirements for operations, discretionary spending—including items such as share
repurchases and acquisitions—and the overall cost of capital. We do not believe that the overall credit concerns in the markets would
impede our ability to access the capital markets because of the overall strength of our financial position.
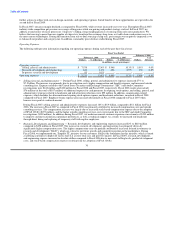
We ended Fiscal 2008 with $9.5 billion in cash and investments compared to $12.4 billion at the end of Fiscal 2007. The decrease in cash
and investments from Fiscal 2007 was a result of spending $4.0 billion on share repurchases and a net $2.2 billion on acquisitions,
partially offset by internally generated cash flows. See "Market Risk" for discussion related to exposure to changes in the market value of
our investment portfolio. In Fiscal 2008, we continued to maintain strong liquidity with cash flows from operations of $3.9 billion,
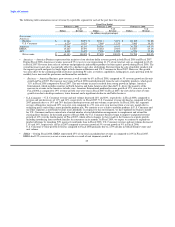
compared to $4.0 billion in Fiscal 2007. The following table summarizes our ending cash, cash equivalents, and investments balances and
contains a summary of our Consolidated Statements of Cash Flows for the past three fiscal years:
Fiscal Year Ended
February 1, February 2,
2008 2007
(in millions)
Cash, cash equivalents, and investments:
Cash and cash equivalents $ 7,764 $ 9,546
Debt securities 1,657 2,784
Equity and other securities 111 115
Cash, cash equivalents and investments $ 9,532 $ 12,445
Fiscal Year Ended
February 1, February 2, February 3,
2008 2007 2006
(in millions)
Net cash flow provided by (used in):
Operating activities $ 3,949 $ 3,969 $ 4,751
Investing activities (1,763) 1,003 4,149
Financing activities (4,120) (2,551) (6,252)
Effect of exchange rate changes on cash and cash equivalents 152 71 (73)
Net (decrease) increase in cash and cash equivalents $ (1,782) $ 2,492 $ 2,575
• Operating Activities — Cash flows from operating activities during Fiscal 2008, 2007, and 2006 resulted primarily from net income,
which represents our principal source of cash. In Fiscal 2008, the slight decrease in operating cash flows was primarily due to
changes in working capital slightly offset by the increase in net income. In Fiscal 2007, the decrease in operating cash flows was
primarily led by a decrease in net income, slightly offset by changes in working capital. See discussion of our cash conversion cycle
in "Key Performance Metrics" below.
Upon adopting SFAS 123(R) in the first quarter of Fiscal 2007, the excess tax benefits associated with employee stock compensation
are classified as a financing activity; however, the offset reduces cash flows from operations. In Fiscal 2008 and 2007, the excess tax
benefit was $12 million and $80 million, respectively. Prior to adopting SFAS 123(R), operating cash flows were impacted by
income tax benefits that resulted from the exercise of employee stock options. These tax benefits totaled $224 million in Fiscal 2006.
These benefits
35