Dell 2007 Annual Report Download - page 33
Download and view the complete annual report
Please find page 33 of the 2007 Dell annual report below. You can navigate through the pages in the report by either clicking on the pages listed below, or by using the keyword search tool below to find specific information within the annual report.-
 1
1 -
2
-
3
-
4
-
5
-
6
-
7
-
8
-
9
-
10
-
11
-
12
-
13
-
14
-
15
-
16
-
17
-
18
-
19
-
20
-
21
-
22
-
 23
23 -
 24
24 -
 25
25 -
 26
26 -
 27
27 -
 28
28 -
 29
29 -
 30
30 -
 31
31 -
 32
32 -
 33
33 -
 34
34 -
 35
35 -
 36
36 -
 37
37 -
 38
38 -
 39
39 -
 40
40 -
 41
41 -
 42
42 -
 43
43 -
44
-
45
-
46
-
47
-
48
-
49
-
50
-
51
-
52
-
53
-
54
-
55
-
56
-
57
-
58
-
59
-
60
-
61
-
62
-
63
-
64
-
65
-
66
-
67
-
68
-
69
-
70
-
71
-
72
-
73
-
74
-
75
-
76
-
77
-
78
-
79
-
80
-
81
-
82
-
83
-
84
-
85
-
86
-
87
-
88
-
89
-
90
-
91
-
92
-
93
-
94
-
95
-
96
-
97
-
98
-
99
-
100
-
101
-
102
-
103
-
104
-
105
-
106
-
107
-
108
-
109
-
110
-
111
-
112
-
113
-
114
-
115
-
116
-
117
-
118
-
119
-
120
-
121
-
122
-
123
-
124
-
125
-
126
-
127
-
128
-
129
-
130
-
131
-
132
-
133
-
134
-
135
-
136
-
137
-
138
-
139
-
140
-
141
-
142
-
143
-
144
-
145
-
146
-
147
-
148
-
149
-
150
-
151
-
152
-
153
-
154
-
155
-
156
-
157
-
158
-
159
-
160
-
161
-
162
-
163
-
164
-
165
-
166
-
167
-
168
-
169
-
170
-
171
-
172
-
173
-
174
-
175
-
176
-
177
-
178
-
179
-
180
-
181
-
182
-
183
-
184
-
185
-
186
-
187
-
188
-
189
-
190
-
191
-
192
-
193
-
194
-
195
-
196
-
197
-
198
-
199
-
200
-
201
-
202
-
203
-
204
-
205
-
206
-
207
-
208
-
209
-
210
-
211
-
212
-
213
-
214
-
215
-
216
-
217
-
218
-
219
-
220
-
221
-
222
-
223
-
224
-
225
-
226
-
227
-
228
-
229
-
230
-
231
-
232
-
233
-
234
-
235
-
236
-
237
-
238
-
239
 |
 |

Table of Contents
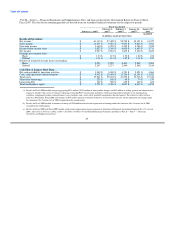
introduced ProSupport, which distilled ten service offerings down to two customizable packages spanning our commercial product and
solutions portfolios with flexible options for service level and proactive management.
In Fiscal 2007, revenue from services increased 20% year-over-year including a 26% year-over-year growth in revenues outside the
Americas. We introduced our new Platinum Plus offering during Fiscal 2007, which contributed to an increase in our premium
service contracts.
• Storage — In Fiscal 2008, storage revenue increased 8% as compared to a 21% increase in Fiscal 2007. All regions contributed to the
revenue growth, led by EMEA, which experienced strong growth of 18%; additionally, APJ and the Americas increased 10% and
5%, respectively. In Fiscal 2008, we expanded both our PowerVault and Dell EMC solutions that drove both additional increases in
performance and customer value. During the fourth quarter of Fiscal 2008, we completed the acquisition of EqualLogic, Inc., an
industry leader in iSCSI SANs. With this acquisition, we now provide much broader product offerings for small and medium
business consumers. Industry analysts believe that the iSCSI SAN space is expected to grow over 125% annually over the next five
years.
In Fiscal 2007, storage revenue sustained double-digit growth with a 21% year-over-year increase. The Americas led the revenue
growth in Fiscal 2007 with a year-over-year increase of 21%. In Fiscal 2007, we also announced a five-year extension to our
partnership with EMC. These portfolio enhancements continue to deliver lower cost solutions for our customers.
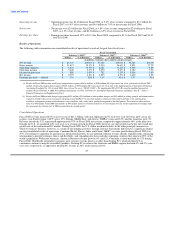
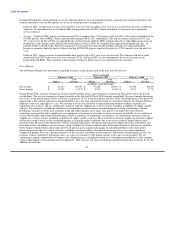
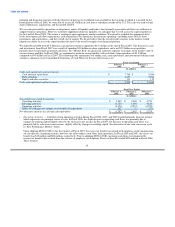
Gross Margin
The following table presents information regarding our gross margin during each of the past three fiscal years:
Fiscal Year Ended
February 1, 2008 February 2, 2007 February 3, 2006
% of % of % of
Dollars Revenue Dollars Revenue Dollars Revenue
(in millions, except percentages)
Net revenue $ 61,133 100.0% $ 57,420 100.0% $ 55,788 100.0%
Gross margin $ 11,671 19.1% $ 9,516 16.6% $ 9,891 17.7%
During Fiscal 2008, our gross margin increased in absolute dollars and as a percentage of revenue from Fiscal 2007, driven by greater
cost declines. The cost environment was more favorable in the first half of Fiscal 2008 than the second half. Our gross margin percentage
was 18.8% in the fourth quarter of Fiscal 2008 as compared to 19.3% in the first quarter of Fiscal 2008. The fourth quarter was positively
impacted by a $58 million reduction in accrued liabilities for a one-time adjustment related to a favorable ruling by the German Federal
Supreme Court on a copyright levy case. We continue to evolve our inventory and manufacturing business model to capitalize on
component cost declines, and we continuously negotiate with our suppliers in a variety of areas including availability of supply, quality,
and cost. We continue to expand our utilization of original design manufacturers, manufacturing outsourcing relationships, and new
distribution strategies to better meet customer needs and reduce product cycle times. Our goal is to introduce the latest relevant
technology more quickly and to rapidly pass on component cost savings to a broader set of our customers worldwide. As we continue to
evolve our inventory and manufacturing business model to capitalize on component cost declines, we continuously negotiate with our
suppliers in a variety of areas including availability of supply, quality, and cost. These real-time continuous supplier negotiations support
our business model, which is able to respond quickly to changing market conditions due to our direct customer model and real-time
manufacturing. Because of the fluid nature of these ongoing negotiations, the timing and amount of supplier discounts and rebates vary
from time to time. In addition, a focus on more richly configured customer solutions and a better mix of products and services yielded a
better balance of profitability and revenue growth. In general, gross margin and margins on individual products will remain under
downward pressure due to a variety of factors, including continued industry wide global pricing pressures, increased competition,
compressed product life cycles, potential increases in the cost and availability of raw materials, and outside manufacturing services. In
response to these competitive pricing pressures, we expect to continue to take pricing actions with respect to our products. We are
continuing to identify opportunities to improve our competitiveness, including lowering costs and improving productivity. One example
of these opportunities is our announcement on March 31, 2008, that we will close our desktop manufacturing facility in Austin, Texas. In
addition, we will take
29