Cigna 2008 Annual Report Download - page 94
Download and view the complete annual report
Please find page 94 of the 2008 Cigna annual report below. You can navigate through the pages in the report by either clicking on the pages listed below, or by using the keyword search tool below to find specific information within the annual report.-
 1
1 -
2
-
3
-
4
-
5
-
6
-
7
-
8
-
9
-
10
-
11
-
12
-
13
-
14
-
15
-
16
-
17
-
18
-
19
-
20
-
21
-
22
-
23
-
24
-
25
-
26
-
27
-
28
-
29
-
30
-
31
-
32
-
33
-
34
-
35
-
36
-
37
-
38
-
39
-
40
-
41
-
42
-
43
-
44
-
45
-
46
-
47
-
48
-
49
-
50
-
51
-
52
-
53
-
54
-
55
-
56
-
57
-
58
-
59
-
60
-
61
-
62
-
63
-
64
-
65
-
66
-
67
-
68
-
69
-
70
-
71
-
72
-
73
-
74
-
75
-
76
-
77
-
78
-
79
-
80
-
81
-
82
-
83
-
 84
84 -
 85
85 -
 86
86 -
 87
87 -
 88
88 -
 89
89 -
 90
90 -
 91
91 -
 92
92 -
 93
93 -
 94
94 -
 95
95 -
 96
96 -
 97
97 -
 98
98 -
 99
99 -
 100
100 -
 101
101 -
 102
102 -
 103
103 -
 104
104 -
105
-
106
-
107
-
108
-
109
-
110
-
111
-
112
-
113
-
114
-
115
-
116
-
117
-
118
-
119
-
120
-
121
-
122
-
123
-
124
-
125
-
126
-
127
-
128
-
129
-
130
-
131
-
132
-
133
-
134
-
135
-
136
-
137
-
138
-
139
-
140
-
141
-
142
-
143
-
144
-
145
-
146
-
147
-
148
-
149
-
150
-
151
-
152
-
153
-
154
-
155
-
156
-
157
-
158
-
159
-
160
-
161
-
162
-
163
-
164
-
165
-
166
-
167
-
168
-
169
-
170
-
171
-
172
-
173
-
174
-
175
-
176
-
177
-
178
-
179
-
180
-
181
-
182
-
183
-
184
-
185
-
186
-
187
-
188
-
189
-
190
-
191
-
192
 |
 |

74
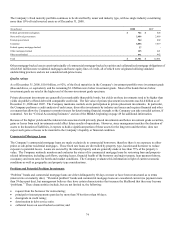
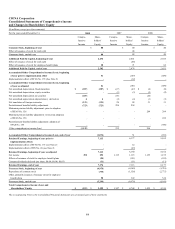
The Company’s fixed maturity portfolio continues to be diversified by issuer and industry type, with no single industry constituting
more than 10% of total invested assets as of December 31, 2008.
(In millions) 2008 2007
Federal government and agency $ 762 $ 628
State and local government 2,486 2,489
Foreign government 944 882
Corporate 6,856 7,419
Federal agency mortgage-backed 37 -
Other mortgage-backed 125 221
Other asset-backed 571 442
Total $ 11,781 $ 12,081
Other mortgage-backed assets consist principally of commercial mortgage-backed securities and collateralized mortgage obligations of
which $41 million were residential mortgages and home equity lines of credit, all of which were originated utilizing standard
underwriting practices and are not considered sub-prime loans.
Quality ratings
As of December 31, 2008, $10.8 billion, or 92%, of the fixed maturities in the Company’s investment portfolio were investment grade
(Baa and above, or equivalent), and the remaining $1.0 billion were below investment grade. Most of the bonds that are below
investment grade are rated at the higher end of the non-investment grade spectrum.
Private placement investments are generally less marketable than public bonds, but yields on these investments tend to be higher than
yields on publicly offered debt with comparable credit risk. The fair value of private placement investments was $4.4 billion as of
December 31, 2008 and 2007. The Company maintains controls on its participation in private placement investments. In particular,
the Company performs a credit analysis of each issuer, diversifies investments by industry and issuer and requires financial and other
covenants that allow the Company to monitor issuers for deteriorating financial strength so the Company can take remedial actions, if
warranted. See the “Critical Accounting Estimates” section of the MD&A beginning on page 49 for additional information.
Because of the higher yields and the inherent risk associated with privately placed investments and below investment grade securities,
gains or losses from such investments could affect future results of operations. However, since management matches the duration of
assets to the duration of liabilities, it expects to hold a significant portion of these assets for the long term and therefore, does not
expect such gains or losses to be material to the Company’s liquidity or financial condition.
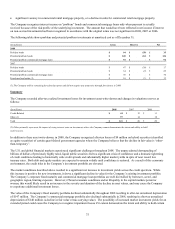
Commercial Mortgage Loans
The Company’s commercial mortgage loans are made exclusively to commercial borrowers; therefore there is no exposure to either
prime or sub-prime residential mortgages. These fixed rate loans are diversified by property type, location and borrower to reduce
exposure to potential losses. Loans are secured by the related property and are generally made at less than 75% of the property’s
value. The Company routinely monitors and evaluates the status of its commercial mortgage loans by reviewing loan and property-
related information, including cash flows, expiring leases, financial health of the borrower and major tenants, loan payment history,
occupancy and room rates for hotels and market conditions. The Company evaluates this information in light of current economic
conditions as well as geographic and property type considerations.
Problem and Potential Problem Investments
“Problem” bonds and commercial mortgage loans are either delinquent by 60 days or more or have been restructured as to terms
(interest rate or maturity date). “Potential problem” bonds and commercial mortgage loans are considered current (no payment more
than 59 days past due), but management believes they have certain characteristics that increase the likelihood that they may become
“problems.” These characteristics include, but are not limited to, the following:
• request from the borrower for restructuring;
• principal or interest payments past due by more than 30 but fewer than 60 days;
• downgrade in credit rating;
• deterioration in debt service ratio;
• collateral losses on asset-backed securities; and