Cigna 2008 Annual Report Download - page 118
Download and view the complete annual report
Please find page 118 of the 2008 Cigna annual report below. You can navigate through the pages in the report by either clicking on the pages listed below, or by using the keyword search tool below to find specific information within the annual report.-
 1
1 -
2
-
3
-
4
-
5
-
6
-
7
-
8
-
9
-
10
-
11
-
12
-
13
-
14
-
15
-
16
-
17
-
18
-
19
-
20
-
21
-
22
-
23
-
24
-
25
-
26
-
27
-
28
-
29
-
30
-
31
-
32
-
33
-
34
-
35
-
36
-
37
-
38
-
39
-
40
-
41
-
42
-
43
-
44
-
45
-
46
-
47
-
48
-
49
-
50
-
51
-
52
-
53
-
54
-
55
-
56
-
57
-
58
-
59
-
60
-
61
-
62
-
63
-
64
-
65
-
66
-
67
-
68
-
69
-
70
-
71
-
72
-
73
-
74
-
75
-
76
-
77
-
78
-
79
-
80
-
81
-
82
-
83
-
84
-
85
-
86
-
87
-
88
-
89
-
90
-
91
-
92
-
93
-
94
-
95
-
96
-
97
-
98
-
99
-
100
-
101
-
102
-
103
-
104
-
105
-
106
-
107
-
 108
108 -
 109
109 -
 110
110 -
 111
111 -
 112
112 -
 113
113 -
 114
114 -
 115
115 -
 116
116 -
 117
117 -
 118
118 -
 119
119 -
 120
120 -
 121
121 -
 122
122 -
 123
123 -
 124
124 -
 125
125 -
 126
126 -
 127
127 -
 128
128 -
129
-
130
-
131
-
132
-
133
-
134
-
135
-
136
-
137
-
138
-
139
-
140
-
141
-
142
-
143
-
144
-
145
-
146
-
147
-
148
-
149
-
150
-
151
-
152
-
153
-
154
-
155
-
156
-
157
-
158
-
159
-
160
-
161
-
162
-
163
-
164
-
165
-
166
-
167
-
168
-
169
-
170
-
171
-
172
-
173
-
174
-
175
-
176
-
177
-
178
-
179
-
180
-
181
-
182
-
183
-
184
-
185
-
186
-
187
-
188
-
189
-
190
-
191
-
192
 |
 |

98
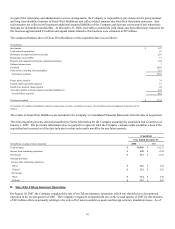
December 31, 2006, the assets and liabilities of the Chilean insurance operations, which were held for sale, were reported in other
assets and accounts payable, accrued expenses and other liabilities.
C. Sale of Retirement Benefits Business
In 2004, the Company sold its retirement benefits business, excluding the corporate life insurance business, for cash proceeds of $2.1
billion. The sale resulted in an initial after-tax gain of $809 million, of which $267 million after-tax was recognized immediately and
the remaining amount was deferred. The Company recognized deferred gains of $3 million after-tax in 2008, $5 million after-tax in
2007 and $14 million after-tax in 2006. As of December 31, 2008, the remaining deferred gain of $33 million after-tax will be
recognized in the Company’s results of operations through 2032.
D. Sale of Individual Life Insurance and Annuity Business
In 1998, the Company sold its individual life insurance and annuity business for cash proceeds of $1.4 billion. The sale generated an
after-tax gain of approximately $800 million, the majority of which was deferred and is recognized at the rate that earnings from the
sold business would have been expected to emerge (primarily over 15 years on a declining basis). The Company recognized deferred
gains of $22 million after-tax in 2008, $25 million after-tax in 2007 and $28 million after-tax in 2006. The remaining deferred gain as
of December 31, 2008, was $108 million after-tax.
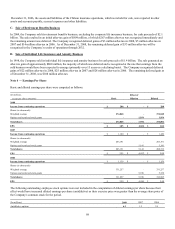
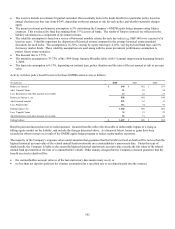
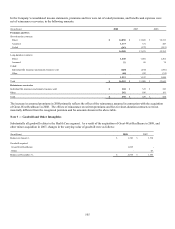
Note 4 — Earnings Per Share
Basic and diluted earnings per share were computed as follows:
(In millions, Effect of
except per share amounts) Basic Dilution Diluted
2008
Income from continuing operations $ 288 $ - $ 288
Shares (in thousands):
Weighted average 274,848 - 274,848
Options and restricted stock grants - 1,954 1,954
Total shares 274,848 1,954 276,802
EPS $ 1.05 $ (0.01) $ 1.04
2007
Income from continuing operations $ 1,120 $ - $ 1,120
Shares (in thousands):
Weighted average 283,191 - 283,191
Options and restricted stock grants 5,141 5,141
Total shares 283,191 5,141 288,332
EPS $ 3.95 $ (0.07) $ 3.88
2006
Income from continuing operations $ 1,159 $ - $ 1,159
Shares (in thousands):
Weighted average 331,257 - 331,257
Options and restricted stock grants 5,728 5,728
Total shares 331,257 5,728 336,985
EPS $ 3.50 $ (0.06) $ 3.44
The following outstanding employee stock options were not included in the computation of diluted earnings per share because their
effect would have increased diluted earnings per share (antidilutive) as their exercise price was greater than the average share price of
the Company's common stock for the period.
(In millions) 2008 2007 2006
Antidilutive options 6.3 1.2 3.9