Cigna 2008 Annual Report Download - page 134
Download and view the complete annual report
Please find page 134 of the 2008 Cigna annual report below. You can navigate through the pages in the report by either clicking on the pages listed below, or by using the keyword search tool below to find specific information within the annual report.-
 1
1 -
2
-
3
-
4
-
5
-
6
-
7
-
8
-
9
-
10
-
11
-
12
-
13
-
14
-
15
-
16
-
17
-
18
-
19
-
20
-
21
-
22
-
23
-
24
-
25
-
26
-
27
-
28
-
29
-
30
-
31
-
32
-
33
-
34
-
35
-
36
-
37
-
38
-
39
-
40
-
41
-
42
-
43
-
44
-
45
-
46
-
47
-
48
-
49
-
50
-
51
-
52
-
53
-
54
-
55
-
56
-
57
-
58
-
59
-
60
-
61
-
62
-
63
-
64
-
65
-
66
-
67
-
68
-
69
-
70
-
71
-
72
-
73
-
74
-
75
-
76
-
77
-
78
-
79
-
80
-
81
-
82
-
83
-
84
-
85
-
86
-
87
-
88
-
89
-
90
-
91
-
92
-
93
-
94
-
95
-
96
-
97
-
98
-
99
-
100
-
101
-
102
-
103
-
104
-
105
-
106
-
107
-
108
-
109
-
110
-
111
-
112
-
113
-
114
-
115
-
116
-
117
-
118
-
119
-
120
-
121
-
122
-
123
-
 124
124 -
 125
125 -
 126
126 -
 127
127 -
 128
128 -
 129
129 -
 130
130 -
 131
131 -
 132
132 -
 133
133 -
 134
134 -
 135
135 -
 136
136 -
 137
137 -
 138
138 -
 139
139 -
 140
140 -
 141
141 -
 142
142 -
 143
143 -
 144
144 -
145
-
146
-
147
-
148
-
149
-
150
-
151
-
152
-
153
-
154
-
155
-
156
-
157
-
158
-
159
-
160
-
161
-
162
-
163
-
164
-
165
-
166
-
167
-
168
-
169
-
170
-
171
-
172
-
173
-
174
-
175
-
176
-
177
-
178
-
179
-
180
-
181
-
182
-
183
-
184
-
185
-
186
-
187
-
188
-
189
-
190
-
191
-
192
 |
 |

114
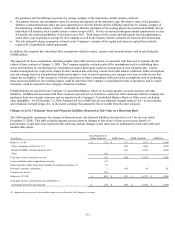
As noted in the table above, total gains and losses included in net income are reflected in the following captions in the Consolidated
Statements of Income:
• Realized investment gains (losses) and net investment income for amounts related to fixed maturities and equity securities; and
• Guaranteed minimum income benefits expense for amounts related to GMIB assets and liabilities.
Reclassifications impacting Level 3 financial instruments are reported as transfers in or out of the Level 3 category as of the beginning
of the quarter in which the transfer occurs. Therefore gains and losses in income only reflect activity for the period the instrument was
classified in Level 3. Typically, investments that transfer out of Level 3 are classified in Level 2 as market data on the securities
becomes more readily available.
The Company provided reinsurance for other insurance companies that offer a guaranteed minimum income benefit, and then
retroceded a portion of the risk to other insurance companies. These arrangements with third party insurers are the instruments still
held at the reporting date for GMIB assets and liabilities in the table above. Because these reinsurance arrangements remain in effect
at the reporting date, the Company has reflected the total gain or loss for the period as the total gain or loss included in income
attributable to instruments still held at the reporting date. However, the Company reduces the GMIB assets and liabilities resulting
from these reinsurance arrangements when annuitants lapse, die, elect their benefit, or reach the age after which the right to elect their
benefit expires.
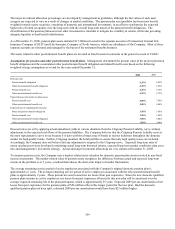
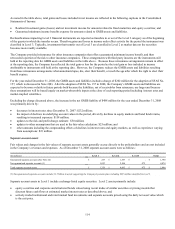
For the year ended December 31, 2008, the GMIB assets and liabilities include a charge of $202 million for the adoption of SFAS No.
157, which is discussed in Note 2(B). After the adoption of SFAS No. 157 in 2008, the Company’s GMIB assets and liabilities are
expected to be more volatile in future periods both because the liabilities, net of receivables from reinsurers, are larger and because
these assumptions will be based largely on market-observable inputs at the close of each reporting period including interest rates and
market-implied volatilities.
Excluding the charge discussed above, the increase in the net GMIB liability of $488 million for the year ended December 31, 2008
was primarily driven by:
• decreases in interest rates since December 31, 2007: $232 million;
• the impact of declines in underlying account values in the period, driven by declines in equity markets and bond fund returns,
resulting in increased exposure: $158 million;
• updates to the risk and profit charge estimate: $50 million;
• updates to other assumptions that are used in the fair value calculation: $25 million; and
• other amounts including the compounding effects of declines in interest rates and equity markets, as well as experience varying
from assumptions: $23 million.
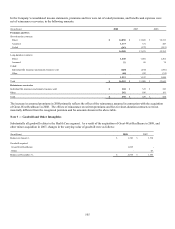
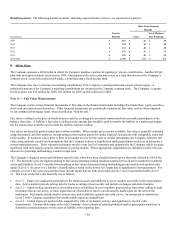
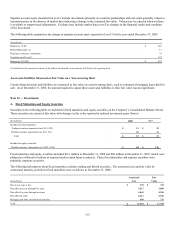
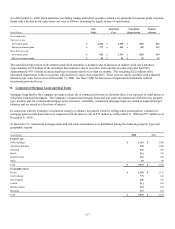
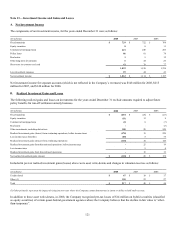
Separate account assets
Fair values and changes in the fair values of separate account assets generally accrue directly to the policyholders and are not included
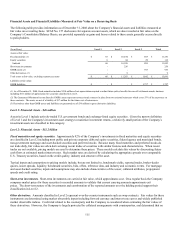
in the Company’s revenues and expenses. As of December 31, 2008 separate account assets were as follows:
(In millions) Level 1 Level 2 Level 3 Total
Guaranteed separate accounts (See Note 22) $ 233 $ 1,557 $ - $ 1,790
Non-guaranteed separate accounts (1) 1,093 2,506 475 4,074
Total separate account assets $ 1,326 $ 4,063 $ 475 $ 5,864
(1) Non-guaranteed separate accounts include $1.5 billion in assets supporting the Company's pension plan, including $435 million classified in Level 3.
Separate account assets in Level 1 include exchange-listed equity securities. Level 2 assets primarily include:
• equity securities and corporate and structured bonds valued using recent trades of similar securities or pricing models that
discount future cash flows at estimated market interest rates as described above; and
• actively-traded institutional and retail mutual fund investments and separate accounts priced using the daily net asset value which
is the exit price.