Cigna 2008 Annual Report Download - page 132
Download and view the complete annual report
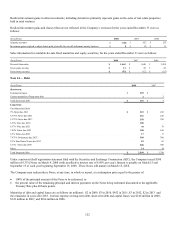
Please find page 132 of the 2008 Cigna annual report below. You can navigate through the pages in the report by either clicking on the pages listed below, or by using the keyword search tool below to find specific information within the annual report.-
 1
1 -
2
-
3
-
4
-
5
-
6
-
7
-
8
-
9
-
10
-
11
-
12
-
13
-
14
-
15
-
16
-
17
-
18
-
19
-
20
-
21
-
22
-
23
-
24
-
25
-
26
-
27
-
28
-
29
-
30
-
31
-
32
-
33
-
34
-
35
-
36
-
37
-
38
-
39
-
40
-
41
-
42
-
43
-
44
-
45
-
46
-
47
-
48
-
49
-
50
-
51
-
52
-
53
-
54
-
55
-
56
-
57
-
58
-
59
-
60
-
61
-
62
-
63
-
64
-
65
-
66
-
67
-
68
-
69
-
70
-
71
-
72
-
73
-
74
-
75
-
76
-
77
-
78
-
79
-
80
-
81
-
82
-
83
-
84
-
85
-
86
-
87
-
88
-
89
-
90
-
91
-
92
-
93
-
94
-
95
-
96
-
97
-
98
-
99
-
100
-
101
-
102
-
103
-
104
-
105
-
106
-
107
-
108
-
109
-
110
-
111
-
112
-
113
-
114
-
115
-
116
-
117
-
118
-
119
-
120
-
121
-
 122
122 -
 123
123 -
 124
124 -
 125
125 -
 126
126 -
 127
127 -
 128
128 -
 129
129 -
 130
130 -
 131
131 -
 132
132 -
 133
133 -
 134
134 -
 135
135 -
 136
136 -
 137
137 -
 138
138 -
 139
139 -
 140
140 -
 141
141 -
 142
142 -
143
-
144
-
145
-
146
-
147
-
148
-
149
-
150
-
151
-
152
-
153
-
154
-
155
-
156
-
157
-
158
-
159
-
160
-
161
-
162
-
163
-
164
-
165
-
166
-
167
-
168
-
169
-
170
-
171
-
172
-
173
-
174
-
175
-
176
-
177
-
178
-
179
-
180
-
181
-
182
-
183
-
184
-
185
-
186
-
187
-
188
-
189
-
190
-
191
-
192
 |
 |
112
adjustment for credit risk was required as of December 31, 2008. The nature and use of these other derivatives are described in Note
12(F).
Level 3: Financial Assets - $1.8 billion and Financial Liabilities - $1.8 billion
The Company classifies certain newly issued, privately placed, complex or illiquid securities, as well as assets and liabilities relating
to guaranteed minimum income benefits in Level 3.
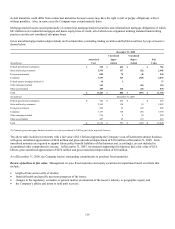
Fixed maturities and equity securities. Approximately 7% or $889 million of fixed maturities and equity securities are priced using
significant unobservable inputs and classified in this category, including:
• $518 million of mortgage and asset-backed securities;
• $270 million of primarily private corporate bonds; and
• $101 million of subordinated loans and private equity investments valued at transaction price in the absence of market data
indicating a change in the estimated fair values.
Fair values of mortgage and asset-backed securities and corporate bonds are determined using pricing models that incorporate the
specific characteristics of each asset and related assumptions including the investment type and structure, credit quality, industry and
maturity date in comparison to current market indices and spreads, liquidity and economic events. For mortgage and asset-backed
securities, inputs and assumptions to pricing may also include collateral attributes and prepayment speeds. Recent trades in the
subject security or similar securities are assessed when available, and the Company may also review published research as well as the
issuer’s financial statements in its evaluation.
Guaranteed minimum income benefit contracts. Because cash flows of the GMIB liabilities and assets are affected by equity
markets and interest rates, and are settled in lump sum payments, the Company reports these liabilities and assets as derivatives at fair
value. The Company estimates the fair value of the assets and liabilities for GMIB contracts using assumptions regarding capital
markets (including market returns, interest rates and market volatilities of the underlying equity and bond mutual fund investments),
future annuitant and retrocessionaire behavior (including mortality, lapse, annuity election rates and retrocessional credit), as well as
risk and profit charges. At adoption of SFAS No. 157, the Company updated assumptions to reflect those that the Company believes a
hypothetical market participant would use to determine a current exit price for these contracts and recorded a charge to net income as
described in Note 2(B). As certain assumptions used to estimate fair values for these contracts are largely unobservable, the Company
classifies assets and liabilities associated with guaranteed minimum income benefits in Level 3 (GMIB assets and liabilities).
These GMIB assets and liabilities are estimated using a complex internal model run using many scenarios to determine the present
value of net amounts expected to be paid, less the present value of net future premiums expected to be received adjusted for risk and
profit charges that the Company estimates a hypothetical market participant would require to assume this business. Net amounts
expected to be paid include the excess of the expected value of the income benefits over the values of the annuitant’s accounts at the
time of annuitization. Generally, market return, interest rate and volatility assumptions are based on market observable
information. Assumptions related to annuitant behavior reflect the Company’s belief that a hypothetical market participant would
consider the actual and expected experience of the Company as well as other relevant and available industry resources in setting
policyholder behavior assumptions. The significant assumptions used to value the GMIB assets and liabilities as of December 31,
2008 were as follows:
• The market return and discount rate assumptions are based on the market-observable LIBOR swap curve.
• The projected interest rate used to calculate the reinsured income benefits is indexed to the 7-year Treasury Rate at the time of
annuitization (claim interest rate) based on contractual terms. That rate was 1.87% at December 31, 2008 and must be projected
for future time periods. These projected rates vary by economic scenario and are determined by an interest rate model using
current interest rate curves and the prices of instruments available in the market including various interest rate caps and zero-
coupon bonds. For a subset of the business, there is a contractually guaranteed floor of 3% for the claim interest rate.
• The market volatility assumptions for annuitants’ underlying mutual fund investments that are modeled based on the S&P 500,
Russell 2000 and NASDAQ Composite are based on the market-implied volatility for these indices for three to seven years
grading to historical volatility levels thereafter. For the remaining 57% of underlying mutual fund investments modeled based on
other indices (with insufficient market-observable data), volatility is based on the average historical level for each index over the
past 10 years. Using this approach, volatility ranges from 16% to 46% for equity funds, 4% to 10% for bond funds and 1% to 2%
for money market funds.
• The mortality assumption is 70% of the 1994 Group Annuity Mortality table, with 1% annual improvement beginning January 1,
2000.
• The lapse rate assumption varies by contract from 2% to 17% and depends on the time since contract issue, the relative value of