Cigna 2008 Annual Report Download - page 151
Download and view the complete annual report
Please find page 151 of the 2008 Cigna annual report below. You can navigate through the pages in the report by either clicking on the pages listed below, or by using the keyword search tool below to find specific information within the annual report.-
 1
1 -
2
-
3
-
4
-
5
-
6
-
7
-
8
-
9
-
10
-
11
-
12
-
13
-
14
-
15
-
16
-
17
-
18
-
19
-
20
-
21
-
22
-
23
-
24
-
25
-
26
-
27
-
28
-
29
-
30
-
31
-
32
-
33
-
34
-
35
-
36
-
37
-
38
-
39
-
40
-
41
-
42
-
43
-
44
-
45
-
46
-
47
-
48
-
49
-
50
-
51
-
52
-
53
-
54
-
55
-
56
-
57
-
58
-
59
-
60
-
61
-
62
-
63
-
64
-
65
-
66
-
67
-
68
-
69
-
70
-
71
-
72
-
73
-
74
-
75
-
76
-
77
-
78
-
79
-
80
-
81
-
82
-
83
-
84
-
85
-
86
-
87
-
88
-
89
-
90
-
91
-
92
-
93
-
94
-
95
-
96
-
97
-
98
-
99
-
100
-
101
-
102
-
103
-
104
-
105
-
106
-
107
-
108
-
109
-
110
-
111
-
112
-
113
-
114
-
115
-
116
-
117
-
118
-
119
-
120
-
121
-
122
-
123
-
124
-
125
-
126
-
127
-
128
-
129
-
130
-
131
-
132
-
133
-
134
-
135
-
136
-
137
-
138
-
139
-
140
-
 141
141 -
 142
142 -
 143
143 -
 144
144 -
 145
145 -
 146
146 -
 147
147 -
 148
148 -
 149
149 -
 150
150 -
 151
151 -
 152
152 -
 153
153 -
 154
154 -
 155
155 -
 156
156 -
 157
157 -
 158
158 -
 159
159 -
 160
160 -
 161
161 -
162
-
163
-
164
-
165
-
166
-
167
-
168
-
169
-
170
-
171
-
172
-
173
-
174
-
175
-
176
-
177
-
178
-
179
-
180
-
181
-
182
-
183
-
184
-
185
-
186
-
187
-
188
-
189
-
190
-
191
-
192
 |
 |

131
• run-off settlement annuity business.
Corporate reflects amounts not allocated to segments, such as interest expense on corporate debt and on uncertain tax positions, net
investment income on investments not supporting segment operations, intersegment eliminations, compensation cost for stock options
and certain corporate overhead expenses.
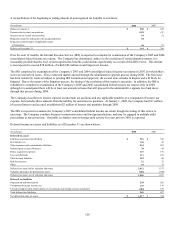
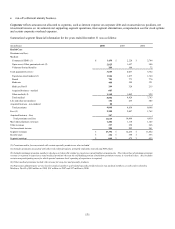
Summarized segment financial information for the years ended December 31 was as follows:
(In millions) 2008 2007 2006
Health Care
Premiums and fees:
Medical:
Commercial HMO (1) $ 1,430 $ 2,220 $ 2,744
Open access/Other guaranteed cost (2) 2,025 1,657 946
Voluntary/limited benefits 200 160 72
Total guaranteed cost (1) 3,655 4,037 3,762
Experience-rated medical (3) 1,946 1,877 1,760
Dental 785 773 776
Medicare 400 349 321
Medicare Part D 299 326 215
Acquired business - medical 603 - -
Other medical (4) 1,168 1,062 929
Total medical 8,856 8,424 7,763
Life and other non-medical 156 235 305
Acquired business - non-medical 28 - -
Total premiums 9,040 8,659 8,068
Fees (5) 2,208 2,007 1,762
Acquired business - Fees 367 - -
Total premiums and fees 11,615 10,666 9,830
Mail order pharmacy revenues 1,204 1,118 1,145
Other revenues 317 250 226
Net investment income 200 202 261
Segment revenues $ 13,336 $ 12,236 $ 11,462
Income taxes $ 352 $ 358 $ 353
Segment earnings $ 664 $ 679 $ 653
(1) Premiums and/or fees associated with certain specialty products are also included.
(2) Includes premiums associated with other risk-related products, primarily indemnity network and PPO plans.
(3) Includes minimum premium members who have a risk profile similar to experience-rated funding arrangements. The risk portion of minimum premium
revenue is reported in experience-rated medical premium whereas the self funding portion of minimum premium revenue is recorded in fees. Also includes
certain non-participating cases for which special customer level reporting of experience is required.
(4) Other medical premiums include risk revenue for stop-loss and specialty products.
(5) Represents administrative service fees for medical members and related specialty product fees for non-medical members as well as fees related to
Medicare Part D of $96 million in 2008, $61 million in 2007 and $27 million in 2006.