Cigna 2008 Annual Report Download - page 74
Download and view the complete annual report
Please find page 74 of the 2008 Cigna annual report below. You can navigate through the pages in the report by either clicking on the pages listed below, or by using the keyword search tool below to find specific information within the annual report.-
 1
1 -
2
-
3
-
4
-
5
-
6
-
7
-
8
-
9
-
10
-
11
-
12
-
13
-
14
-
15
-
16
-
17
-
18
-
19
-
20
-
21
-
22
-
23
-
24
-
25
-
26
-
27
-
28
-
29
-
30
-
31
-
32
-
33
-
34
-
35
-
36
-
37
-
38
-
39
-
40
-
41
-
42
-
43
-
44
-
45
-
46
-
47
-
48
-
49
-
50
-
51
-
52
-
53
-
54
-
55
-
56
-
57
-
58
-
59
-
60
-
61
-
62
-
63
-
 64
64 -
 65
65 -
 66
66 -
 67
67 -
 68
68 -
 69
69 -
 70
70 -
 71
71 -
 72
72 -
 73
73 -
 74
74 -
 75
75 -
 76
76 -
 77
77 -
 78
78 -
 79
79 -
 80
80 -
 81
81 -
 82
82 -
 83
83 -
 84
84 -
85
-
86
-
87
-
88
-
89
-
90
-
91
-
92
-
93
-
94
-
95
-
96
-
97
-
98
-
99
-
100
-
101
-
102
-
103
-
104
-
105
-
106
-
107
-
108
-
109
-
110
-
111
-
112
-
113
-
114
-
115
-
116
-
117
-
118
-
119
-
120
-
121
-
122
-
123
-
124
-
125
-
126
-
127
-
128
-
129
-
130
-
131
-
132
-
133
-
134
-
135
-
136
-
137
-
138
-
139
-
140
-
141
-
142
-
143
-
144
-
145
-
146
-
147
-
148
-
149
-
150
-
151
-
152
-
153
-
154
-
155
-
156
-
157
-
158
-
159
-
160
-
161
-
162
-
163
-
164
-
165
-
166
-
167
-
168
-
169
-
170
-
171
-
172
-
173
-
174
-
175
-
176
-
177
-
178
-
179
-
180
-
181
-
182
-
183
-
184
-
185
-
186
-
187
-
188
-
189
-
190
-
191
-
192
 |
 |

54
SEGMENT REPORTING
Operating segments generally reflect groups of related products, but the International segment is generally based on geography. The
Company measures the financial results of its segments using “segment earnings (loss),” which is defined as income (loss) from
continuing operations excluding after-tax realized investment gains and losses.
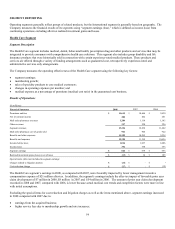
Health Care Segment
Segment Description
The Health Care segment includes medical, dental, behavioral health, prescription drug and other products and services that may be
integrated to provide consumers with comprehensive health care solutions. This segment also includes group disability and life
insurance products that were historically sold in connection with certain experience-rated medical products. These products and
services are offered through a variety of funding arrangements such as guaranteed cost, retrospectively experience-rated and
administrative services only arrangements.
The Company measures the operating effectiveness of the Health Care segment using the following key factors:
• segment earnings;
• membership growth;
• sales of specialty products to core medical customers;
• changes in operating expenses per member; and
• medical expense as a percentage of premiums (medical cost ratio) in the guaranteed cost business.
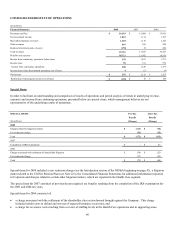
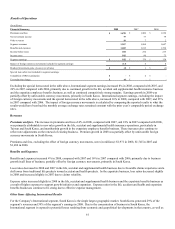
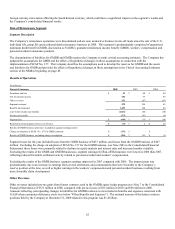
Results of Operations
(In millions)
Financial Summary 2008 2007 2006
Premiums and fees $ 11,615 $ 10,666 $ 9,830
Net investment income 200 202 261
Mail order pharmacy revenues 1,204 1,118 1,145
Other revenues 317 250 226
Segment revenues 13,336 12,236 11,462
Mail order pharmacy cost of goods sold 961 904 922
Benefits and other expenses 11,359 10,295 9,534
Benefits and expenses 12,320 11,199 10,456
Income before taxes 1,016 1,037 1,006
Income taxes 352 358 353
Segment earnings $ 664 $ 679 $ 653
Realized investment gains (losses), net of taxes $(13) $ 14 $ 105
Special items (after-tax) included in segment earnings:
Charges related to litigation matters $(24) $ - $ -
Cost reduction charge $(27) $ - $(15)
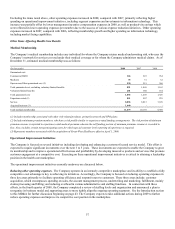
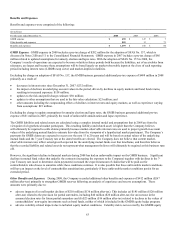
The Health Care segment’s earnings in 2008, as compared with 2007, were favorably impacted by lower management incentive
compensation expense of $21 million after-tax. In addition, the segment's earnings include the after-tax impact of favorable prior year
claim development of $7 million in 2008, $8 million in 2007 and $54 million in 2006. The amount of prior year claim development
recorded in 2008 and 2007, compared with 2006, is lower because actual medical cost trends and completion factors were more in line
with initial assumptions.
Excluding the special items for cost reduction and litigation charges as well as the items mentioned above, segment earnings increased
in 2008 compared with 2007 due to:
• earnings from the acquired business;
• higher service fees due to membership growth and rate increases;