Cigna 2008 Annual Report Download - page 128
Download and view the complete annual report
Please find page 128 of the 2008 Cigna annual report below. You can navigate through the pages in the report by either clicking on the pages listed below, or by using the keyword search tool below to find specific information within the annual report.-
 1
1 -
2
-
3
-
4
-
5
-
6
-
7
-
8
-
9
-
10
-
11
-
12
-
13
-
14
-
15
-
16
-
17
-
18
-
19
-
20
-
21
-
22
-
23
-
24
-
25
-
26
-
27
-
28
-
29
-
30
-
31
-
32
-
33
-
34
-
35
-
36
-
37
-
38
-
39
-
40
-
41
-
42
-
43
-
44
-
45
-
46
-
47
-
48
-
49
-
50
-
51
-
52
-
53
-
54
-
55
-
56
-
57
-
58
-
59
-
60
-
61
-
62
-
63
-
64
-
65
-
66
-
67
-
68
-
69
-
70
-
71
-
72
-
73
-
74
-
75
-
76
-
77
-
78
-
79
-
80
-
81
-
82
-
83
-
84
-
85
-
86
-
87
-
88
-
89
-
90
-
91
-
92
-
93
-
94
-
95
-
96
-
97
-
98
-
99
-
100
-
101
-
102
-
103
-
104
-
105
-
106
-
107
-
108
-
109
-
110
-
111
-
112
-
113
-
114
-
115
-
116
-
117
-
 118
118 -
 119
119 -
 120
120 -
 121
121 -
 122
122 -
 123
123 -
 124
124 -
 125
125 -
 126
126 -
 127
127 -
 128
128 -
 129
129 -
 130
130 -
 131
131 -
 132
132 -
 133
133 -
 134
134 -
 135
135 -
 136
136 -
 137
137 -
 138
138 -
139
-
140
-
141
-
142
-
143
-
144
-
145
-
146
-
147
-
148
-
149
-
150
-
151
-
152
-
153
-
154
-
155
-
156
-
157
-
158
-
159
-
160
-
161
-
162
-
163
-
164
-
165
-
166
-
167
-
168
-
169
-
170
-
171
-
172
-
173
-
174
-
175
-
176
-
177
-
178
-
179
-
180
-
181
-
182
-
183
-
184
-
185
-
186
-
187
-
188
-
189
-
190
-
191
-
192
 |
 |

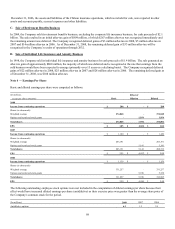
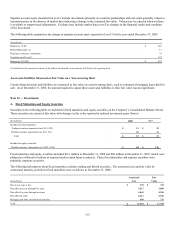
108
factors including but not limited to asset returns, discount rates, and funding targets.
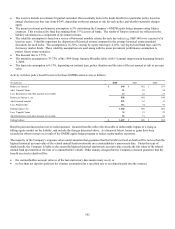
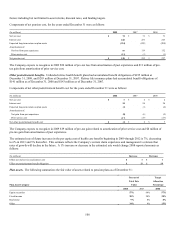
Components of net pension cost, for the years ended December 31 were as follows:
(In millions) 2008 2007 2006
Service cost $ 74 $ 73 $ 71
Interest cost 242 231 223
Expected long-term return on plan assets (234) (209) (208)
Amortization of:
Net loss from past experience 57 119 152
Prior service cost (11) (1) (1)
Net pension cost $ 128 $ 213 $ 237
The Company expects to recognize in 2009 $54 million of pre-tax loss from amortization of past experience and $11 million of pre-
tax gain from amortization of prior service cost.
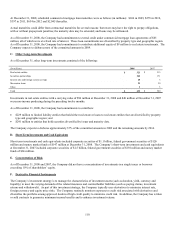
Other postretirement benefits. Unfunded retiree health benefit plans had accumulated benefit obligations of $235 million at
December 31, 2008, and $283 million at December 31, 2007. Retiree life insurance plans had accumulated benefit obligations of
$141 million as of December 31, 2008 and $143 million as of December 31, 2007.
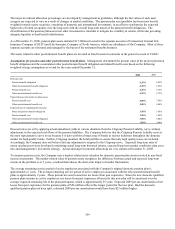
Components of net other postretirement benefit cost for the years ended December 31 were as follows:
(In millions) 2008 2007 2006
Service cost $ 1 $ 2 $ 2
Interest cost 24 24 26
Expected long-term return on plan assets (1) (1) (2)
Amortization of:
Net gain from past experience (8) (6) (2)
Prior service cost (17) (17) (17)
Net other postretirement benefit cost $ (1) $ 2 $ 7
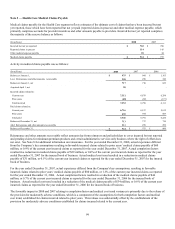
The Company expects to recognize in 2009 $19 million of pre-tax gain related to amortization of prior service cost and $8 million of
pre-tax gain from amortization of past experience.
The estimated rate of future increases in the per capita cost of health care benefits beginning in 2009 through 2012 is 7%, decreasing
to 6% in 2013 and 5% thereafter. This estimate reflects the Company’s current claim experience and management’s estimate that
rates of growth will decline in the future. A 1% increase or decrease in the estimated rate would change 2008 reported amounts as
follows:
(In millions) Increase Decrease
Effect on total service and interest cost $ 1 $ 1
Effect on postretirement benefit obligation $ 11 $ 10
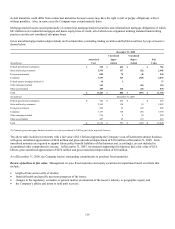
Plan assets. The following summarizes the fair value of assets related to pension plans as of December 31:
Percent of Target
Total Fair Allocation
Plan Asset Category Value Percentage
2008 2007 2008
Equity securities 57% 64% 57%
Fixed income 20% 20% 20%
Real estate 9% 8% 8%
Other 14% 8% 15%