Cigna 2008 Annual Report Download - page 169
Download and view the complete annual report
Please find page 169 of the 2008 Cigna annual report below. You can navigate through the pages in the report by either clicking on the pages listed below, or by using the keyword search tool below to find specific information within the annual report.-
 1
1 -
2
-
3
-
4
-
5
-
6
-
7
-
8
-
9
-
10
-
11
-
12
-
13
-
14
-
15
-
16
-
17
-
18
-
19
-
20
-
21
-
22
-
23
-
24
-
25
-
26
-
27
-
28
-
29
-
30
-
31
-
32
-
33
-
34
-
35
-
36
-
37
-
38
-
39
-
40
-
41
-
42
-
43
-
44
-
45
-
46
-
47
-
48
-
49
-
50
-
51
-
52
-
53
-
54
-
55
-
56
-
57
-
58
-
59
-
60
-
61
-
62
-
63
-
64
-
65
-
66
-
67
-
68
-
69
-
70
-
71
-
72
-
73
-
74
-
75
-
76
-
77
-
78
-
79
-
80
-
81
-
82
-
83
-
84
-
85
-
86
-
87
-
88
-
89
-
90
-
91
-
92
-
93
-
94
-
95
-
96
-
97
-
98
-
99
-
100
-
101
-
102
-
103
-
104
-
105
-
106
-
107
-
108
-
109
-
110
-
111
-
112
-
113
-
114
-
115
-
116
-
117
-
118
-
119
-
120
-
121
-
122
-
123
-
124
-
125
-
126
-
127
-
128
-
129
-
130
-
131
-
132
-
133
-
134
-
135
-
136
-
137
-
138
-
139
-
140
-
141
-
142
-
143
-
144
-
145
-
146
-
147
-
148
-
149
-
150
-
151
-
152
-
153
-
154
-
155
-
156
-
157
-
158
-
 159
159 -
 160
160 -
 161
161 -
 162
162 -
 163
163 -
 164
164 -
 165
165 -
 166
166 -
 167
167 -
 168
168 -
 169
169 -
 170
170 -
 171
171 -
 172
172 -
 173
173 -
 174
174 -
 175
175 -
 176
176 -
 177
177 -
 178
178 -
 179
179 -
180
-
181
-
182
-
183
-
184
-
185
-
186
-
187
-
188
-
189
-
190
-
191
-
192
 |
 |

FS-6
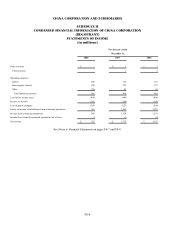
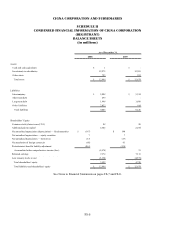
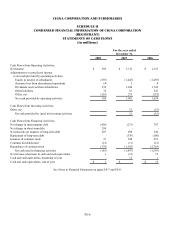
CIGNA CORPORATION AND SUBSIDIARIES
SCHEDULE II
CONDENSED FINANCIAL INFORMATION OF CIGNA CORPORATION
(REGISTRANT)
STATEMENTS OF CASH FLOWS
(in millions)
For the year ended
December 31,
2008 2007 2006
Cash Flows from Operating Activities:
Net Income $ 292 $ 1,115 $ 1,155
Adjustments to reconcile net income
to net cash provided by operating activities:
Equity in income of subsidiaries (595) (1,445) (1,459)
(Income) loss from discontinued operations (4) 5 4
Dividends received from subsidiaries 535 1,026 1,745
Other liabilities 74 87 347
Other, net (116) 275 (172)
Net cash provided by operating activities 186 1,063 1,620
Cash Flows from Investing Activities:
Other, net - 21 (15)
Net cash provided by (used in) investing activities - 21 (15)
Cash Flows from Financing Activities:
Net change in intercompany debt (426) (271) 787
Net change in short-term debt 299 - -
Net proceeds on issuance of long-term debt 297 498 246
Repayment of long-term debt - (376) (100)
Issuance of common stock 37 248 251
Common dividends paid (14) (11) (12)
Repurchase of common stock (378) (1,185) (2,765)
Net cash used in financing activities (185) (1,097) (1,593)
Net increase (decrease) in cash and cash equivalents 1 (13) 12
Cash and cash equivalents, beginning of year - 13 1
Cash and cash equivalents, end of year $ 1 $ - $ 13
See Notes to Financial Statements on pages FS-7 and FS-8.