Cigna 2008 Annual Report Download - page 131
Download and view the complete annual report
Please find page 131 of the 2008 Cigna annual report below. You can navigate through the pages in the report by either clicking on the pages listed below, or by using the keyword search tool below to find specific information within the annual report.-
 1
1 -
2
-
3
-
4
-
5
-
6
-
7
-
8
-
9
-
10
-
11
-
12
-
13
-
14
-
15
-
16
-
17
-
18
-
19
-
20
-
21
-
22
-
23
-
24
-
25
-
26
-
27
-
28
-
29
-
30
-
31
-
32
-
33
-
34
-
35
-
36
-
37
-
38
-
39
-
40
-
41
-
42
-
43
-
44
-
45
-
46
-
47
-
48
-
49
-
50
-
51
-
52
-
53
-
54
-
55
-
56
-
57
-
58
-
59
-
60
-
61
-
62
-
63
-
64
-
65
-
66
-
67
-
68
-
69
-
70
-
71
-
72
-
73
-
74
-
75
-
76
-
77
-
78
-
79
-
80
-
81
-
82
-
83
-
84
-
85
-
86
-
87
-
88
-
89
-
90
-
91
-
92
-
93
-
94
-
95
-
96
-
97
-
98
-
99
-
100
-
101
-
102
-
103
-
104
-
105
-
106
-
107
-
108
-
109
-
110
-
111
-
112
-
113
-
114
-
115
-
116
-
117
-
118
-
119
-
120
-
 121
121 -
 122
122 -
 123
123 -
 124
124 -
 125
125 -
 126
126 -
 127
127 -
 128
128 -
 129
129 -
 130
130 -
 131
131 -
 132
132 -
 133
133 -
 134
134 -
 135
135 -
 136
136 -
 137
137 -
 138
138 -
 139
139 -
 140
140 -
 141
141 -
142
-
143
-
144
-
145
-
146
-
147
-
148
-
149
-
150
-
151
-
152
-
153
-
154
-
155
-
156
-
157
-
158
-
159
-
160
-
161
-
162
-
163
-
164
-
165
-
166
-
167
-
168
-
169
-
170
-
171
-
172
-
173
-
174
-
175
-
176
-
177
-
178
-
179
-
180
-
181
-
182
-
183
-
184
-
185
-
186
-
187
-
188
-
189
-
190
-
191
-
192
 |
 |

111
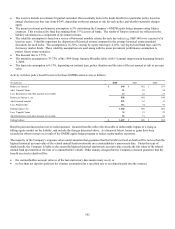
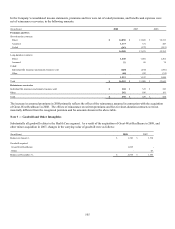
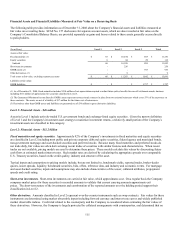
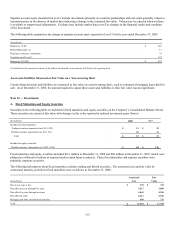
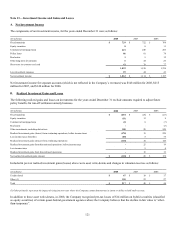
Financial Assets and Financial Liabilities Measured at Fair Value on a Recurring Basis
The following table provides information as of December 31, 2008 about the Company’s financial assets and liabilities measured at
fair value on a recurring basis. SFAS No. 157 disclosures for separate account assets, which are also recorded at fair value on the
Company’s Consolidated Balance Sheets, are provided separately as gains and losses related to these assets generally accrue directly
to policyholders.
(In millions) Level 1 Level 2 Level 3 Total
Assets at fair value:
Fixed maturities (1) $ 38 $ 10,874 $ 869 $ 11,781
Equity securities 8 84 20 112
Subtotal 46 10,958 889 11,893
Short-term investments - 236 - 236
GMIB assets (2) - - 953 953
Other derivatives (3) - 9 - 9
Total assets at fair value, excluding separate accounts $ 46 $ 11,203 $ 1,842 $ 13,091
Liabilities at fair value:
GMIB liabilities $ - $ - $ 1,757 $ 1,757
(1) As of December 31, 2008, fixed maturities includes $514 million of net appreciation required to adjust future policy benefits for run-off settlement annuity business
including $111 million of appreciation for securities classified in Level 3.
(2) The Guaranteed Minimum Income Benefit (GMIB) assets represent retrocessional contracts in place from two external reinsurers which cover 55% of the exposures on
these contracts. The assets are net of a liability of $17 million for the future cost of reinsurance.
(3) Derivatives other than GMIB assets and liabilities are presented net of $36 million in gross derivative liabilities.
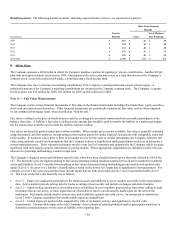
Level 1: Financial Assets - $46 million
Assets in Level 1 include actively-traded U.S. government bonds and exchange-listed equity securities. Given the narrow definition
of Level 1 and the Company's investment asset strategy to maximize investment returns, a relatively small portion of the Company’s
investment assets are classified in this category.
Level 2: Financial Assets - $11.2 billion
Fixed maturities and equity securities. Approximately 92% of the Company’s investments in fixed maturities and equity securities
are classified in Level 2 including most public and private corporate debt and equity securities, federal agency and municipal bonds,
non-government mortgage and asset-backed securities and preferred stocks. Because many fixed maturities and preferred stocks do
not trade daily, fair values are often derived using recent trades of securities with similar features and characteristics. When recent
trades are not available, pricing models are used to determine these prices. These models calculate fair values by discounting future
cash flows at estimated market interest rates. Such market rates are derived by calculating the appropriate spreads over comparable
U.S. Treasury securities, based on the credit quality, industry and structure of the asset.
Typical inputs and assumptions to pricing models include, but are not limited to, benchmark yields, reported trades, broker-dealer
quotes, issuer spreads, liquidity, benchmark securities, bids, offers, reference data, and industry and economic events. For mortgage
and asset-backed securities, inputs and assumptions may also include characteristics of the issuer, collateral attributes, prepayment
speeds and credit rating.
Short-term investments. Short-term investments are carried at fair value, which approximates cost. On a regular basis the Company
compares market prices for these securities to recorded amounts to validate that current carrying amounts approximate exit
prices. The short-term nature of the investments and corroboration of the reported amounts over the holding period support their
classification in Level 2.
Other derivatives. Amounts classified in Level 2 represent over-the-counter instruments such as swap contracts. Fair values for these
instruments are determined using market observable inputs including forward currency and interest rate curves and widely published
market observable indices. Credit risk related to the counterparty and the Company is considered when estimating the fair values of
these derivatives. However, the Company is largely protected by collateral arrangements with counterparties, and determined that no