Cigna 2008 Annual Report Download - page 166
Download and view the complete annual report
Please find page 166 of the 2008 Cigna annual report below. You can navigate through the pages in the report by either clicking on the pages listed below, or by using the keyword search tool below to find specific information within the annual report.-
 1
1 -
2
-
3
-
4
-
5
-
6
-
7
-
8
-
9
-
10
-
11
-
12
-
13
-
14
-
15
-
16
-
17
-
18
-
19
-
20
-
21
-
22
-
23
-
24
-
25
-
26
-
27
-
28
-
29
-
30
-
31
-
32
-
33
-
34
-
35
-
36
-
37
-
38
-
39
-
40
-
41
-
42
-
43
-
44
-
45
-
46
-
47
-
48
-
49
-
50
-
51
-
52
-
53
-
54
-
55
-
56
-
57
-
58
-
59
-
60
-
61
-
62
-
63
-
64
-
65
-
66
-
67
-
68
-
69
-
70
-
71
-
72
-
73
-
74
-
75
-
76
-
77
-
78
-
79
-
80
-
81
-
82
-
83
-
84
-
85
-
86
-
87
-
88
-
89
-
90
-
91
-
92
-
93
-
94
-
95
-
96
-
97
-
98
-
99
-
100
-
101
-
102
-
103
-
104
-
105
-
106
-
107
-
108
-
109
-
110
-
111
-
112
-
113
-
114
-
115
-
116
-
117
-
118
-
119
-
120
-
121
-
122
-
123
-
124
-
125
-
126
-
127
-
128
-
129
-
130
-
131
-
132
-
133
-
134
-
135
-
136
-
137
-
138
-
139
-
140
-
141
-
142
-
143
-
144
-
145
-
146
-
147
-
148
-
149
-
150
-
151
-
152
-
153
-
154
-
155
-
 156
156 -
 157
157 -
 158
158 -
 159
159 -
 160
160 -
 161
161 -
 162
162 -
 163
163 -
 164
164 -
 165
165 -
 166
166 -
 167
167 -
 168
168 -
 169
169 -
 170
170 -
 171
171 -
 172
172 -
 173
173 -
 174
174 -
 175
175 -
 176
176 -
177
-
178
-
179
-
180
-
181
-
182
-
183
-
184
-
185
-
186
-
187
-
188
-
189
-
190
-
191
-
192
 |
 |

FS-3
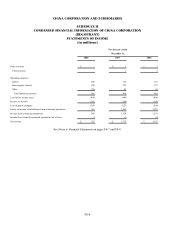
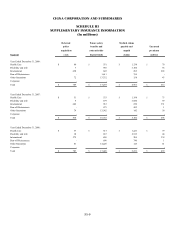
CIGNA CORPORATION AND SUBSIDIARIES
SCHEDULE I
SUMMARY OF INVESTMENTS-OTHER THAN INVESTMENTS IN RELATED PARTIES
December 31, 2008
(in millions)
Amount at
which shown in
Fair the Consolidated
Type of Investment Cost Value Balance Sheet
Fixed maturities:
Bonds:
United States government and government
agencies and authorities $ 359 $ 762 $ 762
States, municipalities and political subdivisions 2,391 2,486 2,486
Foreign governments 882 944 944
Public utilities 740 738 738
All other corporate bonds 6,453 6,095 6,095
Asset backed securities:
United States government agencies mortgage-backed 36 37 37
Other mortgage-backed 150 125 125
Other asset-backed 456 571 571
Redeemable preferred stocks 25 23 23
Total fixed maturities 11,492 11,781 11,781
Equity securities:
Common stocks:
Industrial, miscellaneous and all other 13 24 24
Non redeemable preferred stocks 127 88 88
Total equity securities 140 112 112
Commercial mortgage loans on real estate 3,617 3,617
Policy loans 1,556 1,556
Real estate investments 53 53
Other long-term investments 578 632
Short-term investments 236 236
Total investments $ 17,672 $ 17,987