Cigna 2008 Annual Report Download - page 79
Download and view the complete annual report
Please find page 79 of the 2008 Cigna annual report below. You can navigate through the pages in the report by either clicking on the pages listed below, or by using the keyword search tool below to find specific information within the annual report.-
 1
1 -
2
-
3
-
4
-
5
-
6
-
7
-
8
-
9
-
10
-
11
-
12
-
13
-
14
-
15
-
16
-
17
-
18
-
19
-
20
-
21
-
22
-
23
-
24
-
25
-
26
-
27
-
28
-
29
-
30
-
31
-
32
-
33
-
34
-
35
-
36
-
37
-
38
-
39
-
40
-
41
-
42
-
43
-
44
-
45
-
46
-
47
-
48
-
49
-
50
-
51
-
52
-
53
-
54
-
55
-
56
-
57
-
58
-
59
-
60
-
61
-
62
-
63
-
64
-
65
-
66
-
67
-
68
-
 69
69 -
 70
70 -
 71
71 -
 72
72 -
 73
73 -
 74
74 -
 75
75 -
 76
76 -
 77
77 -
 78
78 -
 79
79 -
 80
80 -
 81
81 -
 82
82 -
 83
83 -
 84
84 -
 85
85 -
 86
86 -
 87
87 -
 88
88 -
 89
89 -
90
-
91
-
92
-
93
-
94
-
95
-
96
-
97
-
98
-
99
-
100
-
101
-
102
-
103
-
104
-
105
-
106
-
107
-
108
-
109
-
110
-
111
-
112
-
113
-
114
-
115
-
116
-
117
-
118
-
119
-
120
-
121
-
122
-
123
-
124
-
125
-
126
-
127
-
128
-
129
-
130
-
131
-
132
-
133
-
134
-
135
-
136
-
137
-
138
-
139
-
140
-
141
-
142
-
143
-
144
-
145
-
146
-
147
-
148
-
149
-
150
-
151
-
152
-
153
-
154
-
155
-
156
-
157
-
158
-
159
-
160
-
161
-
162
-
163
-
164
-
165
-
166
-
167
-
168
-
169
-
170
-
171
-
172
-
173
-
174
-
175
-
176
-
177
-
178
-
179
-
180
-
181
-
182
-
183
-
184
-
185
-
186
-
187
-
188
-
189
-
190
-
191
-
192
 |
 |

59
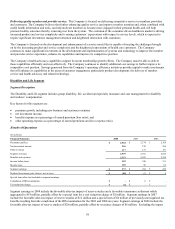
Delivering quality member and provider service. The Company is focused on delivering competitive service to members, providers
and customers. The Company believes that further enhancing quality service can improve member retention and, when combined with
useful health information and tools, can help motivate members to become more engaged in their personal health, and will help
promote healthy outcomes thereby removing cost from the system. The evolution of the consumer-driven healthcare market is driving
increased product and service complexity and is raising customers’ expectations with respect to service levels, which is expected to
require significant investment, management attention and heightened interaction with customers.
The Company is focused on the development and enhancement of a service model that is capable of meeting the challenges brought
on by the increasing product and service complexity and the heightened expectations of health care customers. The Company
continues to make significant investments in the development and implementation of systems and technology to improve the member
and provider service experience, enhance its capabilities and improve its competitive position.
The Company’s health advocacy capabilities support its recent membership growth efforts. The Company must be able to deliver
those capabilities efficiently and cost-effectively. The Company continues to identify additional cost savings to further improve its
competitive cost position. Savings generated from the Company’s operating efficiency initiatives provide capital to make investments
that will enhance its capabilities in the areas of customer engagement, particularly product development, the delivery of member
service and health advocacy and related technology.
Disability and Life Segment
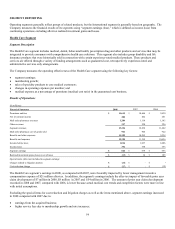
Segment Description
The Disability and Life segment includes group disability, life, accident and specialty insurance and case management for disability
and workers’ compensation.
Key factors for this segment are:
• premium growth, including new business and customer retention;
• net investment income;
• benefits expense as a percentage of earned premium (loss ratio); and
• other operating expense as a percentage of earned premiums and fees (expense ratio).
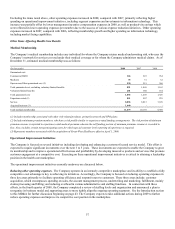
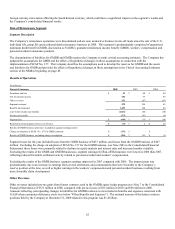
Results of Operations
(In millions)
Financial Summary 2008 2007 2006
Premiums and fees $ 2,562 $ 2,374 $ 2,108
Net investment income 256 276 256
Other revenues 117 131 161
Segment revenues 2,935 2,781 2,525
Benefits and expenses 2,553 2,435 2,214
Income before taxes 382 346 311
Income taxes 109 92 85
Segment earnings $ 273 $ 254 $ 226
Realized investment gains (losses), net of taxes $(48) $(5) $ 6
Special item (after-tax) included in segment earnings:
Completion of IRS examination $ - $ 6 $ -
Cost reduction charge $ (2) $ - $ -
Segment earnings in 2008 include the favorable after-tax impact of reserve studies and a favorable reinsurance settlement which
aggregated to $19 million, partially offset by a special item for a cost reduction charge of $2 million. Segment earnings in 2007
include the favorable after-tax impact of reserve studies of $12 million and a special item of $6 million of previously unrecognized tax
benefits resulting from the completion of the IRS examination for the 2003 and 2004 tax years. Segment earnings in 2006 include the
favorable after-tax impact of reserve studies of $28 million, partially offset by severance charges of $6 million. Excluding the impact