Cigna 2008 Annual Report Download - page 71
Download and view the complete annual report
Please find page 71 of the 2008 Cigna annual report below. You can navigate through the pages in the report by either clicking on the pages listed below, or by using the keyword search tool below to find specific information within the annual report.
51
Balance Sheet Caption /
Nature of Critical Accounting Estimate
Assumptions / Approach Used Effect if Different Assumptions Used
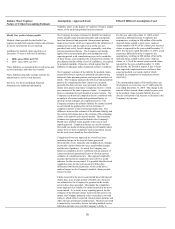
manage these factors through benefit design, underwriting,
provider contracting and the Company's medical
management initiatives. These factors are affected by
changes in the level and mix of medical benefits offered,
including inpatient, outpatient and pharmacy, the impact of
copays and deductibles, changes in provider practices and
changes in consumer demographics and consumption
behavior.
Because historical trend factors are often not representative
of current claim trends, the trend experienced for the most
recent history along with an analysis of emerging trends,
have been taken into consideration in establishing the
liability for medical claims payable at December 31, 2008
and 2007. It is possible that the actual medical trend for the
current period will develop differently from the expected,
which could have a material impact on the Company's
medical claims payable and net income.
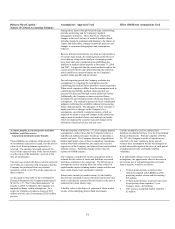
For each reporting period, the Company evaluates key
assumptions by comparing the assumptions used in
establishing the medical claims payable to actual experience.
When actual experience differs from the assumptions used in
establishing the liability, medical claims payable are
increased or decreased through current period net income.
Additionally, the Company evaluates expected future
developments and emerging trends which may impact key
assumptions. The estimation process involves considerable
judgment, reflecting the variability inherent in forecasting
future claim payments. The adequacy of these estimates is
highly sensitive to changes in the Company's key
assumptions, specifically completion factors, which are
impacted by actual or expected changes in the submission
and payment of medical claims, and medical cost trends,
which are impacted by actual or expected changes in the
utilization of medical services and unit costs.
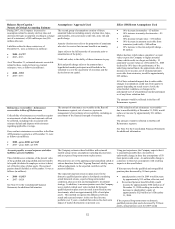
Accounts payable, accrued expenses and other
liabilities, and Other assets -
Guaranteed minimum income benefits
These liabilities are estimates of the present value
of net amounts expected to be paid, less the present
value of net future premiums expected to be
received. The amounts to be paid represent the
excess of the expected value of the income benefit
over the value of the annuitants’ accounts at the
time of annuitization.
The assets associated with these contracts represent
receivables in connection with reinsurance that the
Company has purchased from two external
reinsurers, which covers 55% of the exposures on
these contracts.
As discussed in Note 2(B) to the Consolidated
Financial Statements, the Company implemented
SFAS No. 157, “Fair Value Measurements,” on
January 1, 2008. At adoption, the Company was
required to change certain assumptions. As a
result, the Company recorded a charge of $131
million after-tax, net of reinsurance ($202 million
pre-tax).
With the adoption of SFAS No. 157, the Company updated
assumptions to reflect those that the Company believes a
hypothetical market participant would use to determine a
current exit price. The Company estimates a hypothetical
market participant's view of these assumptions considering
market observable information, the actual and expected
experience of the Company, and other relevant and available
industry sources. Resulting changes in fair value are
reported in GMIB expense.
The Company considers the various assumptions used to
estimate the fair values of assets and liabilities associated
with those contracts in two categories. The first group of
assumptions used to estimate these fair values consist of
capital market inputs including market returns and discount
rates, claim interest rates and market volatility.
Interest rates include (a) market returns, (b) the liability
discount rate assumption and (c) the projected interest rates
used to calculate the reinsured income benefit at the time of
annuitization (claim interest rate).
Volatility refers to the degree of variation of future market
returns of the underlying mutual fund investments.
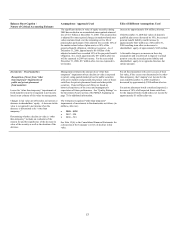
Current assumptions used to estimate these
liabilities are detailed in Note 11 to the Consolidated
Financial Statements. With the adoption of SFAS
No. 157, the Company's results of operations are
expected to be more volatile in future periods
because these assumptions will be based largely on
market-observable inputs at the close of each period
including interest rates and market implied
volatilities.
If an unfavorable change were to occur in these
assumptions, the approximate after-tax decrease in
net income, net of estimated amounts receivable
from reinsurers, would be as follows:
• 50 basis point decrease in interest rates
(which are aligned with LIBOR) used for
projecting market returns and discounting –
$25 million
• 50 basis point decrease in interest rates used
for projecting claim exposure (7-year
Treasury rates) – $20 million
• 20% increase in implied market volatility –
$5 million


