Cigna 2008 Annual Report Download - page 72
Download and view the complete annual report
Please find page 72 of the 2008 Cigna annual report below. You can navigate through the pages in the report by either clicking on the pages listed below, or by using the keyword search tool below to find specific information within the annual report.-
 1
1 -
2
-
3
-
4
-
5
-
6
-
7
-
8
-
9
-
10
-
11
-
12
-
13
-
14
-
15
-
16
-
17
-
18
-
19
-
20
-
21
-
22
-
23
-
24
-
25
-
26
-
27
-
28
-
29
-
30
-
31
-
32
-
33
-
34
-
35
-
36
-
37
-
38
-
39
-
40
-
41
-
42
-
43
-
44
-
45
-
46
-
47
-
48
-
49
-
50
-
51
-
52
-
53
-
54
-
55
-
56
-
57
-
58
-
59
-
60
-
61
-
 62
62 -
 63
63 -
 64
64 -
 65
65 -
 66
66 -
 67
67 -
 68
68 -
 69
69 -
 70
70 -
 71
71 -
 72
72 -
 73
73 -
 74
74 -
 75
75 -
 76
76 -
 77
77 -
 78
78 -
 79
79 -
 80
80 -
 81
81 -
 82
82 -
83
-
84
-
85
-
86
-
87
-
88
-
89
-
90
-
91
-
92
-
93
-
94
-
95
-
96
-
97
-
98
-
99
-
100
-
101
-
102
-
103
-
104
-
105
-
106
-
107
-
108
-
109
-
110
-
111
-
112
-
113
-
114
-
115
-
116
-
117
-
118
-
119
-
120
-
121
-
122
-
123
-
124
-
125
-
126
-
127
-
128
-
129
-
130
-
131
-
132
-
133
-
134
-
135
-
136
-
137
-
138
-
139
-
140
-
141
-
142
-
143
-
144
-
145
-
146
-
147
-
148
-
149
-
150
-
151
-
152
-
153
-
154
-
155
-
156
-
157
-
158
-
159
-
160
-
161
-
162
-
163
-
164
-
165
-
166
-
167
-
168
-
169
-
170
-
171
-
172
-
173
-
174
-
175
-
176
-
177
-
178
-
179
-
180
-
181
-
182
-
183
-
184
-
185
-
186
-
187
-
188
-
189
-
190
-
191
-
192
 |
 |

52
Balance Sheet Caption /
Nature of Critical Accounting Estimate
Assumptions / Approach Used
Effect if Different Assumptions Used
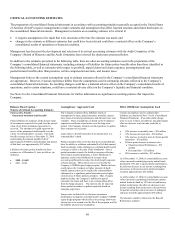
During 2007, the Company increased its
assumption related to annuity election rates and
decreased its lapse assumption resulting in a charge
(net of reinsurance) of $86 million pre-tax ($56
million after-tax).
Liabilities related to these contracts as of
December 31, were as follows (in millions):
• 2008 – $1,757
• 2007– $313
As of December 31, estimated amounts receivable
related to these contracts from two external
reinsurers, were as follows (in millions):
• 2008 – $953
• 2007– $173
The second group of assumptions consists of future
annuitant behavior including annuity election rates, lapse,
and mortality, retrocessionaire credit risk, and a risk and
profit charge.
Annuity election rates refer to the proportion of annuitants
who elect to receive their income benefit as an annuity.
Lapse refers to the full surrender of an annuity prior to
annuitization of the policy.
Credit risk refers to the ability of these reinsurers to pay.
Risk and profit charge refers to the amount that a
hypothetical market participant would include in the
valuation to cover the uncertainty of outcomes and the
desired return on capital.
• 10% decrease in mortality – $3 million
• 10% increase in annuity election rates – $5
million
• 10% decrease in lapse rates – $10 million
• 10% decrease in amounts receivable from
reinsurers (credit risk) – $60 million
• 10% increase to the risk and profit charge –
$5 million
Market declines which reduce annuitants’ account
values expose the Company to higher potential
claims which results in a larger net liability. If
annuitants' account values as of December 31, 2008
declined by 10% due to the performance of the
underlying mutual funds, the approximate after-tax
decrease in net income, net of estimated amounts
receivable from reinsurers, would be approximately
$25 million.
All of these estimated impacts due to unfavorable
changes in assumptions could vary from quarter to
quarter depending on actual reserve levels, the
actual market conditions or changes in the
anticipated view of a hypothetical market participant
as of any future valuation date.
The amounts would be reflected in the Run-off
Reinsurance segment.
Reinsurance recoverables – Reinsurance
recoverables in Run-off Reinsurance
Collectibility of reinsurance recoverables requires
an assessment of risks that such amounts will not
be collected, including risks associated with
reinsurer default and disputes with reinsurers
regarding applicable coverage.
Gross and net reinsurance recoverables in the Run-
off Reinsurance segment as of December 31, were
as follows (in millions):
• 2008 – gross $180; net $169
• 2007 – gross $203; net $191
The amount of reinsurance recoverables in the Run-off
Reinsurance segment, net of reserves, represents
management’s best estimate of recoverability, including an
assessment of the financial strength of reinsurers.
A 10% reduction of net reinsurance recoverables
due to uncollectibility at December 31, 2008, would
reduce net income by approximately $11 million
after-tax.
The amounts would be reflected in the Run-off
Reinsurance segment.
See Note 8 to the Consolidated Financial Statements
for additional information.
Accounts payable, accrued expenses and other
liabilities--pension liabilities
These liabilities are estimates of the present value
of the qualified and nonqualified pension benefits
to be paid (attributed to employee service to date)
net of the fair value of plan assets. The accrued
pension benefit liability as of December 31 was as
follows (in millions):
• 2008 – $1,853
• 2007 – $628
See Note 10 to the Consolidated Financial
Statements for additional information.
The Company estimates these liabilities with actuarial
models using various assumptions including discount rates
and an expected long-term return on plan assets.
Discount rates are set by applying actual annualized yields at
various durations from the Citigroup Pension Liability curve,
without adjustment, to the expected cash flows of the
pension liabilities.
The expected long-term return on plan assets for the
domestic qualified pension plan is developed considering
actual historical returns, expected long-term market
conditions, plan asset mix and management’s investment
strategy. In addition, to measure pension costs the Company
uses a market-related asset value method for domestic
qualified pension plan assets invested in non-fixed income
investments, which are approximately 80% of total plan
assets. This method recognizes the difference between
actual and expected returns in the non-fixed income
portfolio over 5 years, a method that reduces the short-term
impact of market fluctuations on pension cost.
Using past experience, the Company expects that it
is reasonably possible that a favorable or
unfavorable change in these key assumptions of 50
basis points could occur. An unfavorable change is
a decrease in these key assumptions with resulting
impacts as discussed below.
If discount rates for the qualified and nonqualified
pension plans decreased by 50 basis points:
• annual pension costs for 2009 would increase
by approximately $15 million, after-tax; and
• the accrued pension benefit liability would
increase by approximately $180 million as of
December 31, 2008 resulting in an after-tax
decrease to shareholders’ equity of
approximately $120 million as of December
31, 2008.
If the expected long-term return on domestic
qualified pension plan assets decreased by 50 basis
points, annual pension costs for 2009 would