Cigna 2008 Annual Report Download - page 141
Download and view the complete annual report
Please find page 141 of the 2008 Cigna annual report below. You can navigate through the pages in the report by either clicking on the pages listed below, or by using the keyword search tool below to find specific information within the annual report.-
 1
1 -
2
-
3
-
4
-
5
-
6
-
7
-
8
-
9
-
10
-
11
-
12
-
13
-
14
-
15
-
16
-
17
-
18
-
19
-
20
-
21
-
22
-
23
-
24
-
25
-
26
-
27
-
28
-
29
-
30
-
31
-
32
-
33
-
34
-
35
-
36
-
37
-
38
-
39
-
40
-
41
-
42
-
43
-
44
-
45
-
46
-
47
-
48
-
49
-
50
-
51
-
52
-
53
-
54
-
55
-
56
-
57
-
58
-
59
-
60
-
61
-
62
-
63
-
64
-
65
-
66
-
67
-
68
-
69
-
70
-
71
-
72
-
73
-
74
-
75
-
76
-
77
-
78
-
79
-
80
-
81
-
82
-
83
-
84
-
85
-
86
-
87
-
88
-
89
-
90
-
91
-
92
-
93
-
94
-
95
-
96
-
97
-
98
-
99
-
100
-
101
-
102
-
103
-
104
-
105
-
106
-
107
-
108
-
109
-
110
-
111
-
112
-
113
-
114
-
115
-
116
-
117
-
118
-
119
-
120
-
121
-
122
-
123
-
124
-
125
-
126
-
127
-
128
-
129
-
130
-
 131
131 -
 132
132 -
 133
133 -
 134
134 -
 135
135 -
 136
136 -
 137
137 -
 138
138 -
 139
139 -
 140
140 -
 141
141 -
 142
142 -
 143
143 -
 144
144 -
 145
145 -
 146
146 -
 147
147 -
 148
148 -
 149
149 -
 150
150 -
 151
151 -
152
-
153
-
154
-
155
-
156
-
157
-
158
-
159
-
160
-
161
-
162
-
163
-
164
-
165
-
166
-
167
-
168
-
169
-
170
-
171
-
172
-
173
-
174
-
175
-
176
-
177
-
178
-
179
-
180
-
181
-
182
-
183
-
184
-
185
-
186
-
187
-
188
-
189
-
190
-
191
-
192
 |
 |

121
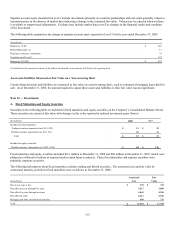
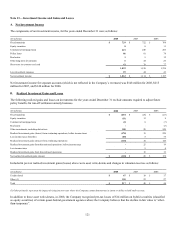
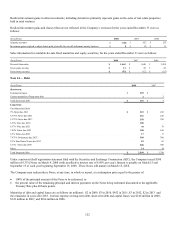
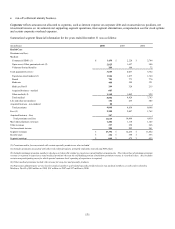
Note 13— Investment Income and Gains and Losses
A. Net Investment Income
The components of net investment income, for the years ended December 31 were as follows:
(In millions) 2008 2007 2006
Fixed maturities $ 729 $ 722 $ 768
Equity securities 8 8 11
Commercial mortgage loans 219 240 266
Policy loans 86 81 78
Real estate 1 5 12
Other long-term investments 6 24 26
Short-term investments and cash 43 78 77
1,092 1,158 1,238
Less investment expenses 29 44 43
Net investment income $ 1,063 $ 1,114 $ 1,195
Net investment income for separate accounts (which is not reflected in the Company’s revenues) was $148 million for 2008, $215
million for 2007, and $140 million for 2006.
B. Realized Investment Gains and Losses
The following realized gains and losses on investments for the years ended December 31 exclude amounts required to adjust future
policy benefits for run-off settlement annuity business.
(In millions) 2008 2007 2006
Fixed maturities $(237) $(26) $(25)
Equity securities (31) 13 8
Commercial mortgage loans (2) 8 (7)
Real estate - - (5)
Other investments, including derivatives 100 20 249
Realized investment gains (losses) from continuing operations, before income taxes (170) 15 220
Less income taxes (benefits) (60) 5 75
Realized investment gains (losses) from continuing operations (110) 10 145
Realized investment gains from discontinued operations, before income taxes - 25 19
Less income taxes - 9 6
Realized investment gains from discontinued operations - 16 13
Net realized investment gains (losses) $(110) $ 26 $ 158
Included in pre-tax realized investment gains (losses) above were asset write-downs and changes in valuation reserves as follows:
(in millions) 2008 2007 2006
Credit related $ 67 $ 18 $ 17
Other (1) 150 22 27
Total $ 217 $ 40 $ 44
(1) Other primarily represents the impact of rising interest rates where the Company cannot demonstrate its intent or ability to hold until recovery.
In addition to these asset write-downs, in 2008, the Company recognized pre-tax losses of $14 million on hybrid securities (classified
as equity securities) of certain quasi-federal government agencies where the Company believes that the decline in fair value is “other-
than-temporary”.