Cigna 2008 Annual Report Download - page 142
Download and view the complete annual report
Please find page 142 of the 2008 Cigna annual report below. You can navigate through the pages in the report by either clicking on the pages listed below, or by using the keyword search tool below to find specific information within the annual report.-
 1
1 -
2
-
3
-
4
-
5
-
6
-
7
-
8
-
9
-
10
-
11
-
12
-
13
-
14
-
15
-
16
-
17
-
18
-
19
-
20
-
21
-
22
-
23
-
24
-
25
-
26
-
27
-
28
-
29
-
30
-
31
-
32
-
33
-
34
-
35
-
36
-
37
-
38
-
39
-
40
-
41
-
42
-
43
-
44
-
45
-
46
-
47
-
48
-
49
-
50
-
51
-
52
-
53
-
54
-
55
-
56
-
57
-
58
-
59
-
60
-
61
-
62
-
63
-
64
-
65
-
66
-
67
-
68
-
69
-
70
-
71
-
72
-
73
-
74
-
75
-
76
-
77
-
78
-
79
-
80
-
81
-
82
-
83
-
84
-
85
-
86
-
87
-
88
-
89
-
90
-
91
-
92
-
93
-
94
-
95
-
96
-
97
-
98
-
99
-
100
-
101
-
102
-
103
-
104
-
105
-
106
-
107
-
108
-
109
-
110
-
111
-
112
-
113
-
114
-
115
-
116
-
117
-
118
-
119
-
120
-
121
-
122
-
123
-
124
-
125
-
126
-
127
-
128
-
129
-
130
-
131
-
 132
132 -
 133
133 -
 134
134 -
 135
135 -
 136
136 -
 137
137 -
 138
138 -
 139
139 -
 140
140 -
 141
141 -
 142
142 -
 143
143 -
 144
144 -
 145
145 -
 146
146 -
 147
147 -
 148
148 -
 149
149 -
 150
150 -
 151
151 -
 152
152 -
153
-
154
-
155
-
156
-
157
-
158
-
159
-
160
-
161
-
162
-
163
-
164
-
165
-
166
-
167
-
168
-
169
-
170
-
171
-
172
-
173
-
174
-
175
-
176
-
177
-
178
-
179
-
180
-
181
-
182
-
183
-
184
-
185
-
186
-
187
-
188
-
189
-
190
-
191
-
192
 |
 |

122
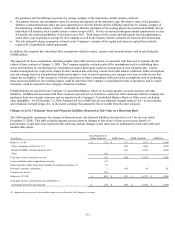
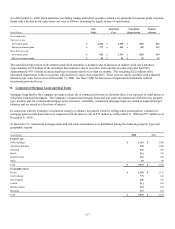
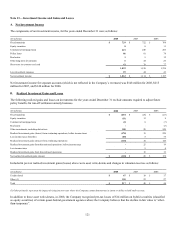
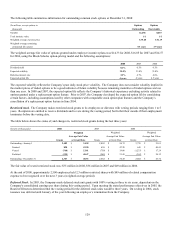
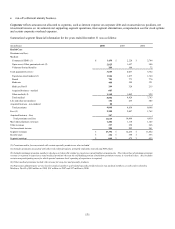
Realized investment gains in other investments, including derivatives primarily represent gains on the sales of real estate properties
held in joint ventures.
Realized investment gains and (losses) that are not reflected in the Company’s revenues for the years ended December 31 were as
follows:
(In millions) 2008 2007 2006
Separate accounts $ (146) $ 652 $ 207
Investment gains required to adjust future policy benefits for run-off settlement annuity business $ 8 $ 18 $ 11
Sales information for available-for-sale fixed maturities and equity securities, for the years ended December 31 were as follows:
(In millions) 2008 2007 2006
Proceeds from sales $ 1,465 $ 1,040 $ 3,458
Gross gains on sales $ 13 $ 26 $ 49
Gross losses on sales $(53) $(12) $(55)
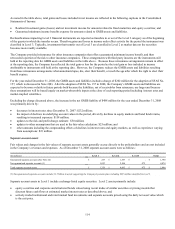
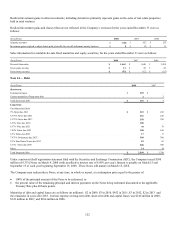
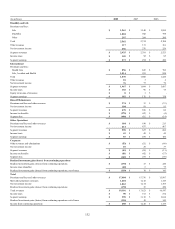
Note 14 ― Debt
(In millions) 2008 2007
Short-term:
Commercial paper $ 299 $ -
Current maturities of long-term debt 2 3
Total short-term debt $ 301 $ 3
Long-term:
Uncollateralized debt:
7% Notes due 2011 $ 222 $ 222
6.375% Notes due 2011 226 226
5.375% Notes due 2017 250 250
6.35% Note due 2018 300 -
6.37% Note due 2021 78 78
7.65% Notes due 2023 100 100
8.3% Notes due 2023 17 17
7.875% Debentures due 2027 300 300
8.3% Step Down Notes due 2033 83 83
6.15% Notes due 2036 500 500
Other 14 14
Total long-term debt $ 2,090 $ 1,790
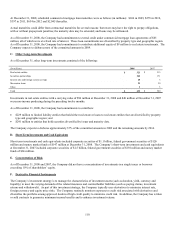
Under a universal shelf registration statement filed with the Securities and Exchange Commission (SEC), the Company issued $300
million of 6.35% Notes on March 4, 2008 (with an effective interest rate of 6.68% per year). Interest is payable on March 15 and
September 15 of each year beginning September 15, 2008. These Notes will mature on March 15, 2018.
The Company may redeem these Notes, at any time, in whole or in part, at a redemption price equal to the greater of:
• 100% of the principal amount of the Notes to be redeemed; or
• the present value of the remaining principal and interest payments on the Notes being redeemed discounted at the applicable
Treasury Rate plus 40 basis points.
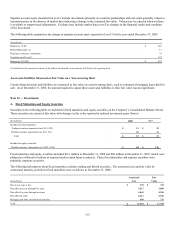
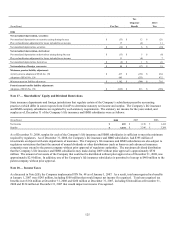
Maturities of debt and capital leases are as follows (in millions): $2 in 2009, $3 in 2010, $452 in 2011, $3 in 2012, $2 in 2013 and
the remainder in years after 2013. Interest expense on long-term debt, short-term debt and capital leases was $146 million in 2008,
$122 million in 2007, and $104 million in 2006.