Cigna 2008 Annual Report Download - page 103
Download and view the complete annual report
Please find page 103 of the 2008 Cigna annual report below. You can navigate through the pages in the report by either clicking on the pages listed below, or by using the keyword search tool below to find specific information within the annual report.-
 1
1 -
2
-
3
-
4
-
5
-
6
-
7
-
8
-
9
-
10
-
11
-
12
-
13
-
14
-
15
-
16
-
17
-
18
-
19
-
20
-
21
-
22
-
23
-
24
-
25
-
26
-
27
-
28
-
29
-
30
-
31
-
32
-
33
-
34
-
35
-
36
-
37
-
38
-
39
-
40
-
41
-
42
-
43
-
44
-
45
-
46
-
47
-
48
-
49
-
50
-
51
-
52
-
53
-
54
-
55
-
56
-
57
-
58
-
59
-
60
-
61
-
62
-
63
-
64
-
65
-
66
-
67
-
68
-
69
-
70
-
71
-
72
-
73
-
74
-
75
-
76
-
77
-
78
-
79
-
80
-
81
-
82
-
83
-
84
-
85
-
86
-
87
-
88
-
89
-
90
-
91
-
92
-
 93
93 -
 94
94 -
 95
95 -
 96
96 -
 97
97 -
 98
98 -
 99
99 -
 100
100 -
 101
101 -
 102
102 -
 103
103 -
 104
104 -
 105
105 -
 106
106 -
 107
107 -
 108
108 -
 109
109 -
 110
110 -
 111
111 -
 112
112 -
 113
113 -
114
-
115
-
116
-
117
-
118
-
119
-
120
-
121
-
122
-
123
-
124
-
125
-
126
-
127
-
128
-
129
-
130
-
131
-
132
-
133
-
134
-
135
-
136
-
137
-
138
-
139
-
140
-
141
-
142
-
143
-
144
-
145
-
146
-
147
-
148
-
149
-
150
-
151
-
152
-
153
-
154
-
155
-
156
-
157
-
158
-
159
-
160
-
161
-
162
-
163
-
164
-
165
-
166
-
167
-
168
-
169
-
170
-
171
-
172
-
173
-
174
-
175
-
176
-
177
-
178
-
179
-
180
-
181
-
182
-
183
-
184
-
185
-
186
-
187
-
188
-
189
-
190
-
191
-
192
 |
 |

83
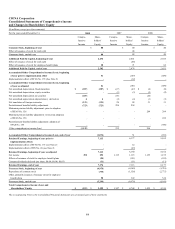
CIGNA Corporation
Consolidated Balance Sheets
(In millions, except per share amounts)
As of December 31, 2008 2007
Assets
Investments:
Fixed maturities, at fair value (amortized cost, $11,492; $11,409) $ 11,781 $ 12,081
Equity securities, at fair value (cost, $140; $127) 112 132
Commercial mortgage loans 3,617 3,277
Policy loans 1,556 1,450
Real estate 53 49
Other long-term investments 632 520
Short-term investments 236 21
Total investments 17,987 17,530
Cash and cash equivalents 1,342 1,970
Accrued investment income 225 233
Premiums, accounts and notes receivable, net 1,407 1,405
Reinsurance recoverables 6,973 7,331
Deferred policy acquisition costs 789 816
Property and equipment 804 625
Deferred income taxes, net 1,617 794
Goodwill 2,878 1,783
Other assets, including other intangibles 1,520 536
Separate account assets 5,864 7,042
Total assets $ 41,406 $ 40,065
Liabilities
Contractholder deposit funds $ 8,539 $ 8,594
Future policy benefits 8,754 8,147
Unpaid claims and claim expenses 4,037 4,127
Health Care medical claims payable 924 975
Unearned premiums and fees 414 496
Total insurance and contractholder liabilities 22,668 22,339
Accounts payable, accrued expenses and other liabilities 6,875 4,127
Short-term debt 301 3
Long-term debt 2,090 1,790
Nonrecourse obligations 16 16
Separate account liabilities 5,864 7,042
Total liabilities 37,814 35,317
Contingencies — Note 22
Shareholders’ Equity
Common stock (par value per share, $0.25; shares issued, 351) 88 88
Additional paid-in capital 2,502 2,474
Net unrealized appreciation (depreciation), fixed maturities $(147) $ 140
Net unrealized appreciation, equity securities 7 7
Net unrealized depreciation, derivatives (13) (19)
Net translation of foreign currencies (60) 61
Postretirement benefits liability adjustment (861) (138)
Accumulated other comprehensive income (loss) (1,074) 51
Retained earnings 7,374 7,113
Less treasury stock, at cost (5,298) (4,978)
Total shareholders’ equity 3,592 4,748
Total liabilities and shareholders’ equity $ 41,406 $ 40,065
Shareholders’ Equity Per Share $ 13.25 $ 16.98
The accompanying Notes to the Consolidated Financial Statements are an integral part of these statements.