Capital One 2001 Annual Report Download - page 7
Download and view the complete annual report
Please find page 7 of the 2001 Capital One annual report below. You can navigate through the pages in the report by either clicking on the pages listed below, or by using the keyword search tool below to find specific information within the annual report.-
 1
1 -
 2
2 -
 3
3 -
 4
4 -
 5
5 -
 6
6 -
 7
7 -
 8
8 -
 9
9 -
 10
10 -
 11
11 -
 12
12 -
 13
13 -
 14
14 -
 15
15 -
 16
16 -
 17
17 -
 18
18 -
19
-
20
-
21
-
22
-
23
-
24
-
25
-
26
-
27
-
28
-
29
-
30
-
31
-
32
-
33
-
34
-
35
-
36
-
37
-
38
-
39
-
40
-
41
-
42
-
43
-
44
-
45
-
46
-
47
-
48
-
49
-
50
-
51
-
52
-
53
-
54
-
55
-
56
-
57
-
58
-
59
-
60
-
61
-
62
-
63
-
64
-
65
-
66
-
67
-
68
-
69
-
70
 |
 |
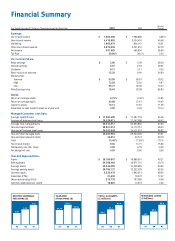
Financial Summary
Percent
Year Ended December 31 (Dollars in Thousands, Except Per Share Data) 2001 2000 Change
Earnings:
Net interest income $1,663,390 $ 1,588,885 4.69 %
Non-interest income 4,419,893 3,034,416 45.66
Marketing 1,082,979 906,147 19.51
Other non-interest expense 2,975,048 2,241,510 32.73
Net income 641,965 469,634 36.69
Tax Rate 38.00 % 38.0 % 0.00
Per Common Share:
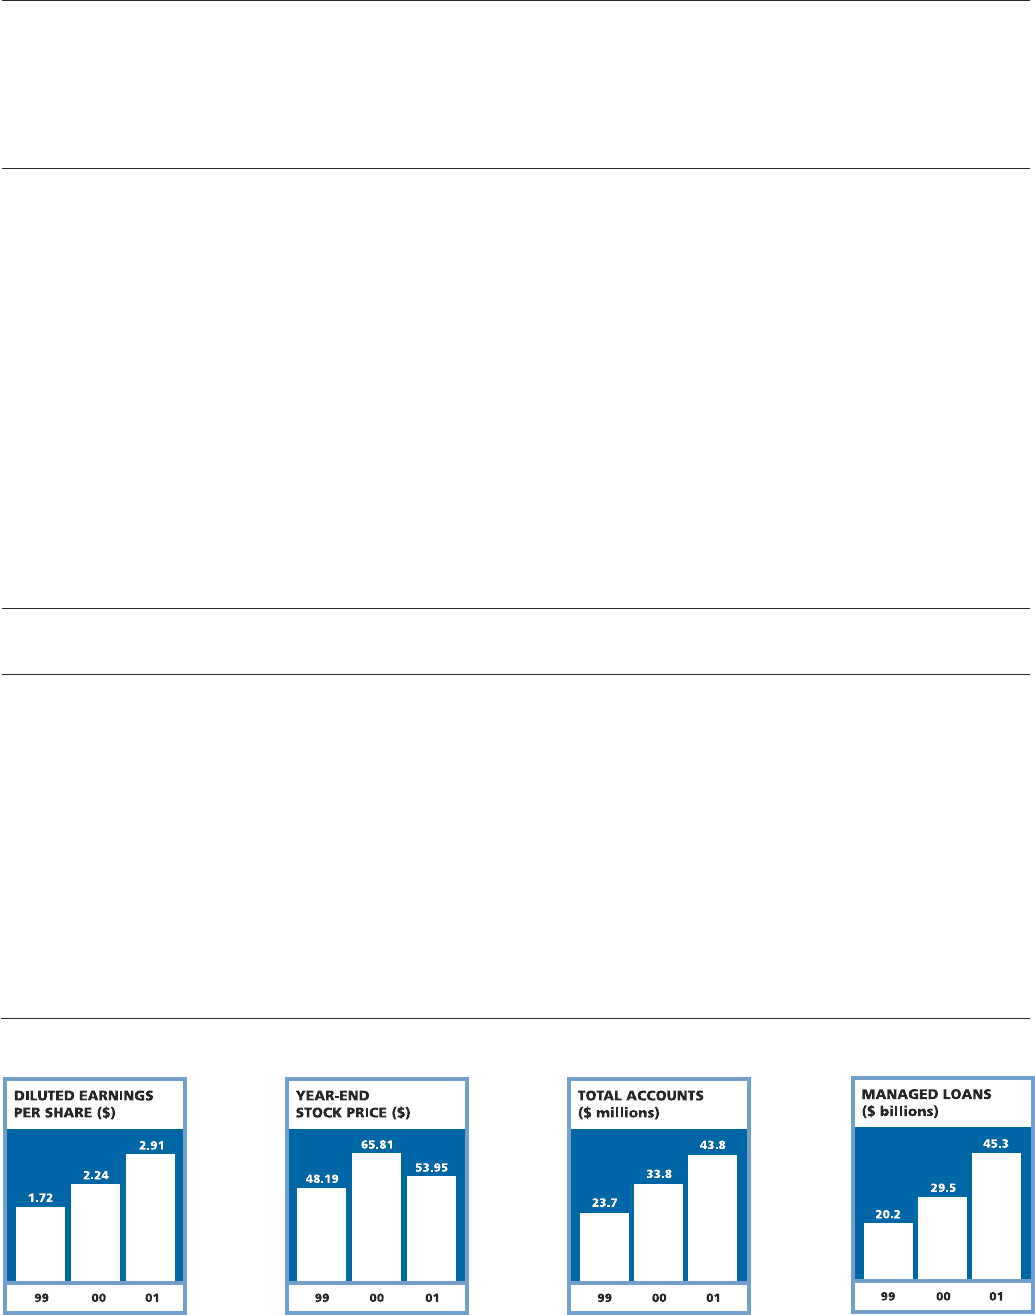
Basic earnings $ 3.06 $ 2.39 28.03
Diluted earnings 2.91 2.24 29.91
Dividends 0.11 0.11 0.00
Book value as of year-end 15.33 9.94 54.93
Market prices
Year-end $53.95 $65.81 -18.02
High 72.58 73.22 -0.97
Low 36.41 32.06 13.47
Price/Earnings ratio 18.54 29.38 -36.90
Ratios:
Return on average assets 2.75 % 3.09 % -10.95
Return on average equity 23.08 27.61 -16.40
Capital to assets 12.14 10.91 11.29
Allowance for loan losses to loans as of year-end 4.02 3.49 15.14
Managed Consumer Loan Data:
Average reported loans $ 17,284,306 $ 11,487,776 50.46
Average off-balance sheet loans 18,328,011 11,147,086 64.42
Average total managed loans 35,612,317 22,634,862 57.33
Year-end reported loans 20,921,014 15,112,712 38.43
Year-end off-balance sheet loans 24,342,949 14,411,314 68.92
Year-end total managed loans 45,263,963 29,524,026 53.31
Year-end total accounts (000s) 43,815 33,774 29.73
Yield 15.48 % 17.83 % -13.15
Net interest margin 9.04 10.71 -15.66
Delinquency rate (30+ days) 4.95 5.23 -5.35
Net charge-off rate 4.04 3.90 3.56
Year-End Reported Data:
Assets $28,184,047 $ 18,889,341 49.21
Earning assets 24,388,463 16,971,741 43.70
Average assets 23,346,309 15,209,585 53.50
Average earning assets 20,706,172 13,252,033 56.25
Common equity 3,323,478 1,962,514 69.35
Associates (FTEs) 21,648 19,247 12.47
Shares outstanding (000s) 216,778 197,369 9.36
Common stockholders of record 10,065 10,019 0.46