Capital One 2001 Annual Report Download - page 31
Download and view the complete annual report
Please find page 31 of the 2001 Capital One annual report below. You can navigate through the pages in the report by either clicking on the pages listed below, or by using the keyword search tool below to find specific information within the annual report.-
 1
1 -
2
-
3
-
4
-
5
-
6
-
7
-
8
-
9
-
10
-
11
-
12
-
13
-
14
-
15
-
16
-
17
-
18
-
19
-
20
-
 21
21 -
 22
22 -
 23
23 -
 24
24 -
 25
25 -
 26
26 -
 27
27 -
 28
28 -
 29
29 -
 30
30 -
 31
31 -
 32
32 -
 33
33 -
 34
34 -
 35
35 -
 36
36 -
 37
37 -
 38
38 -
 39
39 -
 40
40 -
 41
41 -
42
-
43
-
44
-
45
-
46
-
47
-
48
-
49
-
50
-
51
-
52
-
53
-
54
-
55
-
56
-
57
-
58
-
59
-
60
-
61
-
62
-
63
-
64
-
65
-
66
-
67
-
68
-
69
-
70
 |
 |

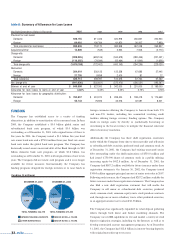
Servicing and securitizations income decreased $34.7 million, or 3%, to
$1.2 billion for the year ended December 31, 2000, compared to 1999.
This decrease was primarily due to an increase in net charge-offs on
such loans as a result of the seasoning of accounts combined with a
change in customer usage patterns,resulting in decreases of certain fees.
Certain estimates inherent in the determination of the fair value of the
retained interests are influenced by factors outside the Company’s
control, and as a result, such estimates could materially change in the
near term. Any future gains that will be recognized in accordance with
SFAS 140 will be dependent on the timing and amount of future
securitizations. The Company intends to continuously assess the
performance of new and existing securitization transactions as
estimates of future cash flows change.
OTHER NON-INTEREST INCOME
Interchange income increased $142.0 million, or 60%, to $379.8
million for the year ended December 31, 2001, from $237.8 million in
2000. This increase was primarily attributable to increased purchase
volume and new account growth for the year ended December 31,
2001. Service charges and other customer-related fees decreased by
$45.3 million, or 3%, to $1.6 billion for the year ended December 31,
2001. This decrease was primarily due to the shift in the mix of the
reported loan portfolio toward a greater composition of lower fee-
generating loans, offset by a 39% increase in the average number of
accounts in 2001.
Interchange income increased $93.5 million, or 65%, to $237.8 million
for the year ended December 31, 2000, from $144.3 million in 1999.
Service charges and other customer-related fees increased to $1.6
billion, or 58%, for the year ended December 31, 2000, compared to
$1.0 billion for the year ended December 31, 1999. These increases
were primarily due to a 41% increase in the average number of
accounts for the year ended December 31, 2000, from 1999, an increase
in purchase volume, customer usage patterns and increased purchases
of cross-sell products.
NON-INTEREST EXPENSE
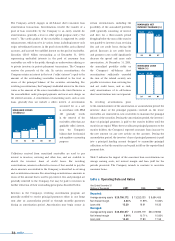
Non-interest expense for the year ended December 31, 2001, increased
$910.4 million, or 29%, to $4.1 billion from $3.1 billion for the year
ended December 31, 2000. Contributing to the increase in non-interest
expense were marketing expenses, which increased $176.8 million, or
20%, to $1.1 billion in 2001, from $906.1 million in 2000. The increase
in marketing expenses during 2001 reflects the Company’s continued
identification of and investments in opportunities for growth, as well
as our marketing extension into television advertisements. Salaries and
associate benefits increased $368.7 million, or 36%, to $1.4 billion in
2001, from $1.0 billion in 2000, as the Company added approximately
2,400 net new associates to our staffing levels to manage the growth in
the Company’s accounts. All other non-interest expenses increased
$364.8 million, or 30%, to $1.6 billion for the year ended December 31,
2001, from $1.2 billion in 2000. The increase in other non-interest
expenses was primarily composed of
increased depreciation expense due to
premises and equipment growth,
increased collections costs as a result of
increased collection and recovery
efforts, and non-recurring expenses
such as the write-off of an investment
in an ancillary business as well as costs
associated with the mailing of
amendments to customer account
agreements. The increase was also driven by the 39% increase in
average accounts.
Non-interest expense for the year ended December 31, 2000, increased
$682.7 million, or 28%, to $3.1 billion from $2.5 billion for the year
ended December 31, 1999. Contributing to the increase in non-interest
expense were marketing expenses which increased $174.2 million, or
24%, to $906.1 million in 2000, from $731.9 million in 1999. The
increase in marketing expenses during 2000 reflects the Company’s
continued identification of and investments in opportunities for
growth. Salaries and associate benefits increased $243.2 million, or
31%, to $1.0 billion in 2000, from $780.2 million in 1999, as the
Company added approximately 3,800 net new associates to our staffing
levels to manage the growth in the Company’s accounts.All other non-
interest expenses increased $265.2 million, or 28%, to $1.2 billion for
the year ended December 31, 2000, from $952.9 million in 1999. The
increase in other non-interest expense, as well as the increase in salaries
and associate benefits, was primarily a result of a 41% increase in the
average number of accounts for the year ended December 31, 2000,
and the Company’s continued exploration and testing of new products
and markets.
INCOME TAXES
The Company’s income tax rate was 38%, 38% and 37%, for the years
ended December 31, 2001, 2000 and 1999, respectively. The effective
rate includes both state and federal income tax components.
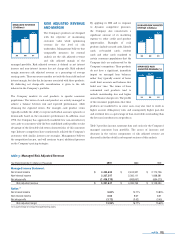
ASSET QUALITY
The asset quality of a portfolio is generally a function of the initial
underwriting criteria used, levels of competition, account management
activities and demographic concentration, as well as general economic
conditions. The seasoning of the accounts is also an important factor
in the delinquency and loss levels of the portfolio. Accounts tend to
exhibit a rising trend of delinquency and credit losses as they season.
As of December 31, 2001 and 2000, 58% and 60% of managed
accounts, respectively, representing 51% of the total managed loan
balance, were less than eighteen months old. Accordingly, it is likely
that the Company’s managed loan portfolio could experience
increased levels of delinquency and credit losses as the average age of
the Company’s accounts increases.
md&a 29