Capital One 2001 Annual Report Download - page 29
Download and view the complete annual report
Please find page 29 of the 2001 Capital One annual report below. You can navigate through the pages in the report by either clicking on the pages listed below, or by using the keyword search tool below to find specific information within the annual report.-
 1
1 -
2
-
3
-
4
-
5
-
6
-
7
-
8
-
9
-
10
-
11
-
12
-
13
-
14
-
15
-
16
-
17
-
18
-
 19
19 -
 20
20 -
 21
21 -
 22
22 -
 23
23 -
 24
24 -
 25
25 -
 26
26 -
 27
27 -
 28
28 -
 29
29 -
 30
30 -
 31
31 -
 32
32 -
 33
33 -
 34
34 -
 35
35 -
 36
36 -
 37
37 -
 38
38 -
 39
39 -
40
-
41
-
42
-
43
-
44
-
45
-
46
-
47
-
48
-
49
-
50
-
51
-
52
-
53
-
54
-
55
-
56
-
57
-
58
-
59
-
60
-
61
-
62
-
63
-
64
-
65
-
66
-
67
-
68
-
69
-
70
 |
 |

md&a 27
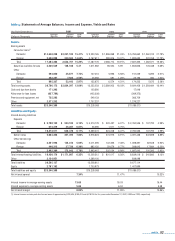
table 4: Statements of Average Balances, Income and Expense, Yields and Rates
Year Ended December 31 2001 2000 1999
Average Income/ Yield/ Average Income/ Yield/ Average Income/ Yield/
(Dollars in Thousands) Balance Expense Rate Balance Expense Rate Balance Expense Rate
Assets:
Earning assets
Consumer loans(1)
Domestic $14,648,298 $2,257,183 15.41% $ 9,320,165 $ 1,996,968 21.43% $ 5,784,662 $ 1,260,313 21.79%
Foreign 2,636,008 358,584 14.63% 2,167,611 289,806 13.37% 1,882,693 222,058 11.79%
Total 17,284,306 2,642,767 15.29% 11,487,776 2,286,774 19.91% 7,667,355 1,482,371 19.33%
Securities available for sale 2,526,529 138,188 5.47 1,611,582 96,554 5.99 1,852,826 105,438 5.69%
Other
Domestic 593,050 45,877 7.74% 107,416 5,993 5.58% 151,029 5,295 3.51%
Foreign 302,287 7,565 2.50% 45,259 581 1.28% 23,196 380 1.64%
Total 895,337 53,442 5.97% 152,675 6,574 4.31% 174,225 5,675 3.26%
Total earning assets 20,706,172 $2,834,397 13.69% 13,252,033 $ 2,389,902 18.03% 9,694,406 $ 1,593,484 16.44%
Cash and due from banks 171,392 103,390 17,046
Allowance for loan losses (637,789) (402,208) (269,375)
Premises and equipment, net 735,282 549,133 366,709
Other 2,371,252 1,707,237 1,276,227
Total assets $23,346,309 $15,209,585 $11,085,013
Liabilities and Equity:
Interest-bearing liabilities
Deposits
Domestic $9,700,132 $ 594,183 6.13% $ 5,313,178 $ 322,497 6.07% $ 2,760,536 $ 137,792 4.99%
Foreign 673,379 46,287 6.87% 26,296 1,511 5.75%
Total 10,373,511 640,470 6.17% 5,339,474 324,008 6.07% 2,760,536 137,792 4.99%
Senior notes 5,064,356 357,495 7.06% 3,976,623 274,975 6.91% 4,391,438 302,698 6.89%
Other borrowings
Domestic 2,551,996 145,316 5.69% 2,011,295 142,355 7.08% 1,398,397 82,508 5.90%
Foreign 440,313 27,726 6.30% 882,120 59,679 6.77% 288,645 17,884 6.20%
Total 2,992,309 173,042 5.78% 2,893,415 202,034 6.98% 1,687,042 100,392 5.95%
Total interest-bearing liabilities 18,430,176 $1,171,007 6.35% 12,209,512 $ 801,017 6.56% 8,839,016 $ 540,882 6.12%
Other 2,134,951 1,299,100 838,098
Total liabilities 20,565,127 13,508,612 9,677,114
Equity 2,781,182 1,700,973 1,407,899
Total liabilities and equity $23,346,309 $15,209,585 $11,085,013
Net interest spread 7.34% 11.47% 10.32%
Interest income to average earning assets 13.69 18.03 16.44
Interest expense to average earning assets 5.66 6.04 5.58
Net interest margin 8.03% 11.99% 10.86%
(1) Interest income includes past-due fees on loans of approximately $709,596, $780,014 and $478,918 for the years ended December 31, 2001, 2000 and 1999, respectively.