Capital One 2001 Annual Report Download - page 62
Download and view the complete annual report
Please find page 62 of the 2001 Capital One annual report below. You can navigate through the pages in the report by either clicking on the pages listed below, or by using the keyword search tool below to find specific information within the annual report.-
 1
1 -
2
-
3
-
4
-
5
-
6
-
7
-
8
-
9
-
10
-
11
-
12
-
13
-
14
-
15
-
16
-
17
-
18
-
19
-
20
-
21
-
22
-
23
-
24
-
25
-
26
-
27
-
28
-
29
-
30
-
31
-
32
-
33
-
34
-
35
-
36
-
37
-
38
-
39
-
40
-
41
-
42
-
43
-
44
-
45
-
46
-
47
-
48
-
49
-
50
-
51
-
 52
52 -
 53
53 -
 54
54 -
 55
55 -
 56
56 -
 57
57 -
 58
58 -
 59
59 -
 60
60 -
 61
61 -
 62
62 -
 63
63 -
 64
64 -
 65
65 -
 66
66 -
 67
67 -
 68
68 -
 69
69 -
 70
70
 |
 |

If these assumptions are not met or change, the interest-only strip and
related servicing and securitizations income would be affected. The
following adverse changes to the key assumptions and estimates,
presented in accordance with SFAS 140, are hypothetical and should be
used with caution. As the figures indicate, any change in fair value
based on a 10% or 20% variation in assumptions cannot be
extrapolated because the relationship of change in assumption to the
change in fair value may not be linear. Also, the effect of a variation in a
particular assumption on the fair value of the interest-only strip is
calculated independently from any change in another assumption.
However, changes in one factor may result in changes in other factors,
which might magnify or counteract the sensitivities.
Static pool credit losses are calculated by summing the actual and
projected future credit losses and dividing them by the original balance of
each pool of asset. Due to the short-term revolving nature of consumer
loan receivables, the weighted average percentage of static pool credit
losses is not considered to be materially different from the assumed
charge-off rates used to determine the fair value of retained interests.
In addition to the interest-only strip, the Company maintains other
residual interests to enhance the credit quality of the pool of
receivables. The other residual interests may be in various forms,
including subordinated interests in the transferred receivables, cash
collateral accounts and accrued but unbilled interest on the transferred
receivables. These other residual interests are carried at cost, which
approximates fair value. The credit risk exposure on residual interests
exceeds the pro rata share of the Company’s interest in the pool of
receivables. Residual interests are recorded in accounts receivable from
securitizations and totaled $934,305 and $479,123 at December 31,
2001 and 2000, respectively.
The Company acts as a servicing agent and receives contractual
servicing fees of approximately 2% of the investor principal
outstanding. The servicing revenues associated with transferred
receivables adequately compensate the Company for servicing the
accounts. Accordingly, no servicing asset or liability has been recorded.
The Company’s residual interests are generally restricted or
subordinated to investors’ interests and their value is subject to
substantial credit, repayment and interest rate risks on the transferred
financial assets. The investors and the trusts have no recourse to the
Company’s assets if the securitized loans are not paid when due.
For the year ended December 31, 2001 and 2000, the Company
recognized $68,135 and $30,466, respectively, in gains related to the
new transfer of receivables accounted for as sales, net of transaction
costs. These gains are recorded in servicing and securitizations income.
60 notes
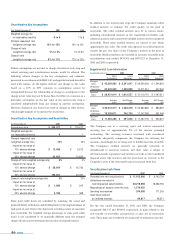
Securitization Key Assumptions and Sensitivities
As of December 31 2001 2000
Interest-only strip $269,527 $ 119,412
Weighted average life
for receivables (months) 97
Principal repayment rate
(weighted average rate) 13% 16 %
Impact on fair value of
10% adverse change $12,496 $ 5,912
Impact on fair value of
20% adverse change 23,652 10,626
Charge-off rate (weighted average rate) 6% 4%
Impact on fair value of
10% adverse change $50,844 $ 16,733
Impact on fair value of
20% adverse change 100,854 33,467
Discount rate (weighted average rate) 9% 12 %
Impact on fair value of
10% adverse change $1,889 $ 245
Impact on fair value of
20% adverse change 3,706 488
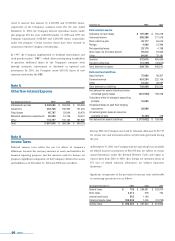
Supplemental Loan Information
Year Ended December 31 2001 2000
Loans Loans Loans Loans
Outstanding Delinquent Outstanding Delinquent
Managed
loans $45,263,963 $ 2,241,647 $ 29,524,026 $ 1,544,654
Off-balance
sheet loans 24,342,949 1,229,090 14,411,314 447,343
Consumer
loans $20,921,014 $ 1,012,557 $ 15,112,712 $ 1,097,311
Average Net Charge- Average Net Charge-
Loans Offs Loans Offs
Managed
loans $ 35,612,317 $ 1,438,370 $ 22,634,862 $ 883,667
Off-balance
sheet loans 18,328,011 746,734 11,147,086 351,046
Consumer
loans $17,284,306 $ 691,636 $ 11,487,776 $ 532,621
Securitization Cash Flows
Year Ended December 31 2001 2000
Proceeds from new securitizations $11,915,990 $ 6,142,709
Collections reinvested in
revolving-period securitizations 30,218,660 18,566,784
Repurchases of accounts from the trust 1,579,455
Servicing fees received 330,350 171,245
Cash flows received
on retained interests 84,817 48,211
Securitization Key Assumptions
Year Ended December 31 2001 2000
Weighted average life
for receivables (months) 6 to 9 7 to 8
Principal repayment rate
(weighted average rate) 13% to 15% 13% to 16%
Charge-off rate
(weighted average rate) 4% to 6% 4% to 6%
Discount rate
(weighted average rate) 9% to 11% 11% to 13%