Capital One 2001 Annual Report Download - page 45
Download and view the complete annual report
Please find page 45 of the 2001 Capital One annual report below. You can navigate through the pages in the report by either clicking on the pages listed below, or by using the keyword search tool below to find specific information within the annual report.-
 1
1 -
2
-
3
-
4
-
5
-
6
-
7
-
8
-
9
-
10
-
11
-
12
-
13
-
14
-
15
-
16
-
17
-
18
-
19
-
20
-
21
-
22
-
23
-
24
-
25
-
26
-
27
-
28
-
29
-
30
-
31
-
32
-
33
-
34
-
 35
35 -
 36
36 -
 37
37 -
 38
38 -
 39
39 -
 40
40 -
 41
41 -
 42
42 -
 43
43 -
 44
44 -
 45
45 -
 46
46 -
 47
47 -
 48
48 -
 49
49 -
 50
50 -
 51
51 -
 52
52 -
 53
53 -
 54
54 -
 55
55 -
56
-
57
-
58
-
59
-
60
-
61
-
62
-
63
-
64
-
65
-
66
-
67
-
68
-
69
-
70
 |
 |

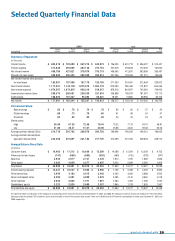
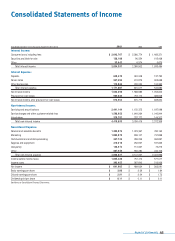
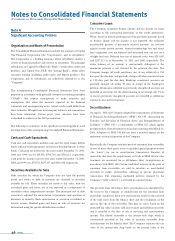
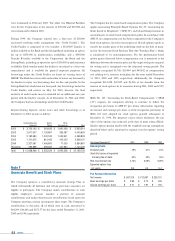
financial statements 43
Year Ended December 31 (In Thousands, Except Per Share Data) 2001 2000 1999
Interest Income:
Consumer loans, including fees $2,642,767 $ 2,286,774 $ 1,482,371
Securities available for sale 138,188 96,554 105,438
Other 53,442 6,574 5,675
Total interest income 2,834,397 2,389,902 1,593,484
Interest Expense:
Deposits 640,470 324,008 137,792
Senior notes 357,495 274,975 302,698
Other borrowings 173,042 202,034 100,392
Total interest expense 1,171,007 801,017 540,882
Net interest income 1,663,390 1,588,885 1,052,602
Provision for loan losses 989,836 718,170 382,948
Net interest income after provision for loan losses 673,554 870,715 669,654
Non-Interest Income:
Servicing and securitizations 2,441,144 1,152,375 1,187,098
Service charges and other customer-related fees 1,598,952 1,644,264 1,040,944
Interchange 379,797 237,777 144,317
Total non-interest income 4,419,893 3,034,416 2,372,359
Non-Interest Expense:
Salaries and associate benefits 1,392,072 1,023,367 780,160
Marketing 1,082,979 906,147 731,898
Communications and data processing 327,743 296,255 264,897
Supplies and equipment 310,310 252,937 181,663
Occupancy 136,974 112,667 72,275
Other 807,949 556,284 434,103
Total non-interest expense 4,058,027 3,147,657 2,464,996
Income before income taxes 1,035,420 757,474 577,017
Income taxes 393,455 287,840 213,926
Net income $641,965 $ 469,634 $ 363,091
Basic earnings per share $3.06 $ 2.39 $ 1.84
Diluted earnings per share $2.91 $ 2.24 $ 1.72
Dividends paid per share $0.11 $ 0.11 $ 0.11
See Notes to Consolidated Financial Statements.
Consolidated Statements of Income