Capital One 2001 Annual Report Download - page 47
Download and view the complete annual report
Please find page 47 of the 2001 Capital One annual report below. You can navigate through the pages in the report by either clicking on the pages listed below, or by using the keyword search tool below to find specific information within the annual report.-
 1
1 -
2
-
3
-
4
-
5
-
6
-
7
-
8
-
9
-
10
-
11
-
12
-
13
-
14
-
15
-
16
-
17
-
18
-
19
-
20
-
21
-
22
-
23
-
24
-
25
-
26
-
27
-
28
-
29
-
30
-
31
-
32
-
33
-
34
-
35
-
36
-
 37
37 -
 38
38 -
 39
39 -
 40
40 -
 41
41 -
 42
42 -
 43
43 -
 44
44 -
 45
45 -
 46
46 -
 47
47 -
 48
48 -
 49
49 -
 50
50 -
 51
51 -
 52
52 -
 53
53 -
 54
54 -
 55
55 -
 56
56 -
 57
57 -
58
-
59
-
60
-
61
-
62
-
63
-
64
-
65
-
66
-
67
-
68
-
69
-
70
 |
 |

financial statements 45
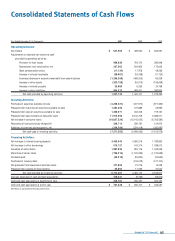
Year Ended December 31 (In Thousands) 2001 2000 1999
Operating Activities:
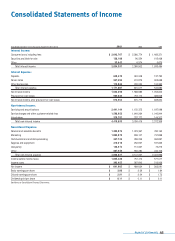
Net income $641,965 $469,634 $ 363,091
Adjustments to reconcile net income to cash
provided by operating activities:
Provision for loan losses 989,836 718,170 382,948
Depreciation and amortization, net 337,562 244,823 172,623
Stock compensation plans (11,134) 17,976 49,236
Increase in interest receivable (20,087) (18,038) (11,720)
(Increase) decrease in accounts receivable from securitizations (1,266,268) (468,205) 65,208
Increase in other assets (323,758) (16,513) (156,639)
Increase in interest payable 55,060 6,253 24,768
Increase in other liabilities 864,573 489,001 383,820
Net cash provided by operating activities 1,267,749 1,443,101 1,273,335
Investing Activities:
Purchases of securities available for sale (4,268,527) (407,572) (871,355)
Proceeds from maturities of securities available for sale 1,481,390 172,889 42,995
Proceeds from sales of securities available for sale 1,356,971 432,203 719,161
Proceeds from securitizations of consumer loans 11,915,990 6,142,709 2,586,517
Net increase in consumer loans (18,057,529) (12,145,055) (6,763,580)
Recoveries of loans previously charged off 326,714 239,781 124,673
Additions of premises and equipment, net (326,594) (374,018) (350,987)
Net cash used in investing activities (7,571,585) (5,939,063) (4,512,576)
Financing Activities:
Net increase in interest-bearing deposits 4,459,943 4,595,216 1,783,830
Net increase in other borrowings 515,121 145,214 1,038,010
Issuances of senior notes 1,987,833 994,176 1,453,059
Maturities of senior notes (706,916) (1,125,292) (1,012,639)
Dividends paid (22,310) (20,824) (20,653)
Purchases of treasury stock (134,619) (107,104)
Net proceeds from issuances of common stock 477,892 21,076 14,028
Proceeds from exercise of stock options 62,804 11,225 37,040
Net cash provided by financing activities 6,774,367 4,486,172 3,185,571
Increase (decrease) in cash and cash equivalents 470,531 (9,790) (53,670)
Cash and cash equivalents at beginning of year 236,707 246,497 300,167
Cash and cash equivalents at end of year $707,238 $ 236,707 $ 246,497
See Notes to Consolidated Financial Statements.
Consolidated Statements of Cash Flows