Capital One 2001 Annual Report Download - page 35
Download and view the complete annual report
Please find page 35 of the 2001 Capital One annual report below. You can navigate through the pages in the report by either clicking on the pages listed below, or by using the keyword search tool below to find specific information within the annual report.-
 1
1 -
2
-
3
-
4
-
5
-
6
-
7
-
8
-
9
-
10
-
11
-
12
-
13
-
14
-
15
-
16
-
17
-
18
-
19
-
20
-
21
-
22
-
23
-
24
-
 25
25 -
 26
26 -
 27
27 -
 28
28 -
 29
29 -
 30
30 -
 31
31 -
 32
32 -
 33
33 -
 34
34 -
 35
35 -
 36
36 -
 37
37 -
 38
38 -
 39
39 -
 40
40 -
 41
41 -
 42
42 -
 43
43 -
 44
44 -
 45
45 -
46
-
47
-
48
-
49
-
50
-
51
-
52
-
53
-
54
-
55
-
56
-
57
-
58
-
59
-
60
-
61
-
62
-
63
-
64
-
65
-
66
-
67
-
68
-
69
-
70
 |
 |

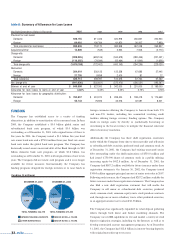
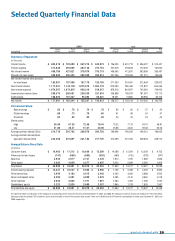
Table 9 reflects the costs of other borrowings of the Company as of and for each of the years ended December 31, 2001, 2000 and 1999.
Table 10 shows the maturities of domestic time certificates of deposit in denominations of $100,000 or greater (large denomination CDs) as of
December 31, 2001.
Additional information regarding funding can be found in Note E to the Consolidated Financial Statements.
Table 11 summarizes the amounts and maturities of the contractual funding obligations of the Company, including off-balance sheet funding.
md&a 33
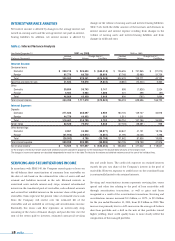
table 9: Short-Term Borrowings Maximum
Outstanding Outstanding Average Year-End
as of any as of Average Interest Interest
(Dollars in Thousands) Month-End Year-End Outstanding Rate Rate
2001
Federal funds purchased
and resale agreements $1,643,524 $ 434,024 $ 1,046,647 3.77% 1.91%
Other 616,584 449,393 224,995 7.66% 2.29%
Total $883,417 $ 1,271,642 4.46% 2.10%
2000
Federal funds purchased
and resale agreements $ 1,303,714 $ 1,010,693 $ 1,173,267 6.26% 6.58%
Other 371,020 43,359 129,700 11.52 6.17
Total $ 1,054,052 $ 1,302,967 6.79% 6.56%
1999
Federal funds purchased
and resale agreements $ 1,491,463 $ 1,240,000 $ 1,046,475 5.33% 5.84%
Other 193,697 97,498 175,593 8.42 3.97
Total $ 1,337,498 $ 1,222,068 5.77% 5.70%
table 10: Maturities of Large Denomination Certificates — $100,000 or More
December 31, 2001 (Dollars in Thousands) Balance Percent
3 months or less $719,957 15.57%
Over 3 through 6 months 491,885 10.64
Over 6 through 12 months 919,073 19.88
Over 12 months 2,492,081 53.91
Total $4,622,996 100.00%
table 11: Funding Obligations
As of December 31, 2001 Total Up to 1 year 1-3 years 4-5 years After 5 years
Interest bearing deposits $ 12,838,968 $ 3,723,143 $ 4,794,191 $ 4,028,736 $ 292,898
Senior notes 5,335,229 518,635 2,148,045 2,269,262 399,287
Other borrowings 3,995,528 1,691,436 1,370,228 486,000 447,864
Operating leases 253,571 57,619 87,749 51,949 56,254
Off-balance sheet securitization amortization 24,322,085 3,734,661 7,939,135 8,474,385 4,173,904
Total obligations $ 46,745,381 $ 9,725,494 $ 16,339,348 $ 15,310,332 $ 5,370,207