Capital One 2001 Annual Report Download - page 32
Download and view the complete annual report
Please find page 32 of the 2001 Capital One annual report below. You can navigate through the pages in the report by either clicking on the pages listed below, or by using the keyword search tool below to find specific information within the annual report.-
 1
1 -
2
-
3
-
4
-
5
-
6
-
7
-
8
-
9
-
10
-
11
-
12
-
13
-
14
-
15
-
16
-
17
-
18
-
19
-
20
-
21
-
 22
22 -
 23
23 -
 24
24 -
 25
25 -
 26
26 -
 27
27 -
 28
28 -
 29
29 -
 30
30 -
 31
31 -
 32
32 -
 33
33 -
 34
34 -
 35
35 -
 36
36 -
 37
37 -
 38
38 -
 39
39 -
 40
40 -
 41
41 -
 42
42 -
43
-
44
-
45
-
46
-
47
-
48
-
49
-
50
-
51
-
52
-
53
-
54
-
55
-
56
-
57
-
58
-
59
-
60
-
61
-
62
-
63
-
64
-
65
-
66
-
67
-
68
-
69
-
70
 |
 |

Changes in the rates of delinquency and credit losses can also result
from a shift in the product mix. As discussed in “Risk Adjusted
Revenue and Margin,” certain customized card products have, in some
cases, higher delinquency and higher charge-off rates. In the case of
secured card loans, collateral, in the form of cash deposits, reduces any
ultimate charge-offs. The costs associated with higher delinquency and
charge-off rates are considered in the pricing of individual products.
During 2001, general economic conditions for consumer credit
deteriorated slightly as industry levels of charge-offs (including
bankruptcies) and delinquencies both increased. These trends did not
have a material impact on the Company’s 2001 results.
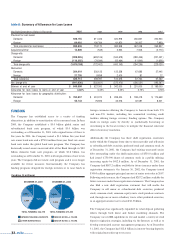
DELINQUENCIES
Table 6 shows the Company’s consumer loan delinquency trends for
the years presented on a reported and managed basis. The entire
balance of an account is contractually delinquent if the minimum
payment is not received by the payment due date. Delinquencies not
only have the potential to impact earnings if the account charges off,
but they also result in additional costs in terms of the personnel and
other resources dedicated to resolving the delinquencies.
NET CHARGE-OFFS
Net charge-offs include the principal amount of losses (excluding
accrued and unpaid finance charges, fees and fraud losses) less current
period recoveries. The Company charges off credit card loans (net of
any collateral) at 180 days past the due date and generally charges off
other consumer loans at 120 days past the due date. All amounts
collected on previously charged-off accounts are included in
recoveries. Costs to recover previously charged-off accounts are
recorded as collections expense in non-interest expenses.
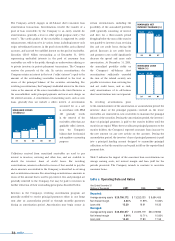
The 30-plus day delinquency rate for
the managed consumer loan portfolio
was 4.95% as of December 31, 2001,
down 28 basis points from 5.23% as of
December 31, 2000. The 30-plus day
delinquency rate for the reported
consumer loan portfolio decreased to
4.84% as of December 31, 2001, from
7.26% as of December 31, 2000. Both
reported and managed consumer
loan delinquency rate decreases as
of December 31, 2001, as compared
to December 31, 2000. principally
reflected improvements in customer
credit performance including enhanced
payment activity. The decrease in the
reported consumer loan delinquency
rate was also a result of a shift in the
mix of the composition of the reported
portfolio towards lower yielding, higher
credit quality loans.
30 md&a
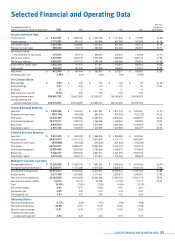
table 6: Delinquencies
As of December 31 2001 2000 1999 1998 1997
% of % of % of % of % of
Total Total Total Total Total
(Dollars in Thousands) Loans Loans Loans Loans Loans Loans Loans Loans Loans Loans
Reported:
Loans outstanding $20,921,014 100.00% $ 15,112,712 100.00% $ 9,913,549 100.00% $ 6,157,111 100.00% $ 4,861,687 100.00%
Loans delinquent:
30–59 days 494,871 2.37 418,967 2.77 236,868 2.39 123,162 2.00 104,216 2.14
60–89 days 233,206 1.11 242,770 1.61 129,251 1.30 67,504 1.10 64,217 1.32
90 or more days 284,480 1.36 435,574 2.88 220,513 2.23 98,798 1.60 99,667 2.05
Total $1,012,557 4.84% $ 1,097,311 7.26% $ 586,632 5.92% $ 289,464 4.70% $ 268,100 5.51%
Loans delinquent by geographic area:
Domestic 930,077 5.02% 1,034,995 8.23% 533,081 6.85% 264,966 5.80% 264,942 5.96%
Foreign 82,480 3.47% 62,316 2.46% 53,551 2.51% 24,498 1.54% 3,158 0.75%
Managed:
Loans outstanding $45,263,963 100.00% $ 29,524,026 100.00% $20,236,588 100.00% $17,395,126 100.00% $ 14,231,015 100.00%
Loans delinquent:
30–59 days 934,681 2.06 605,040 2.05 416,829 2.06 329,239 1.89 327,407 2.30
60–89 days 502,959 1.11 349,250 1.18 238,476 1.18 182,982 1.05 213,726 1.50
90 or more days 804,007 1.78 590,364 2.00 403,464 1.99 305,589 1.76 340,887 2.40
Total $2,241,647 4.95% $ 1,544,654 5.23% $ 1,058,769 5.23% $ 817,810 4.70% $ 882,020 6.20%