Capital One 2001 Annual Report Download - page 33
Download and view the complete annual report
Please find page 33 of the 2001 Capital One annual report below. You can navigate through the pages in the report by either clicking on the pages listed below, or by using the keyword search tool below to find specific information within the annual report.-
 1
1 -
2
-
3
-
4
-
5
-
6
-
7
-
8
-
9
-
10
-
11
-
12
-
13
-
14
-
15
-
16
-
17
-
18
-
19
-
20
-
21
-
22
-
 23
23 -
 24
24 -
 25
25 -
 26
26 -
 27
27 -
 28
28 -
 29
29 -
 30
30 -
 31
31 -
 32
32 -
 33
33 -
 34
34 -
 35
35 -
 36
36 -
 37
37 -
 38
38 -
 39
39 -
 40
40 -
 41
41 -
 42
42 -
 43
43 -
44
-
45
-
46
-
47
-
48
-
49
-
50
-
51
-
52
-
53
-
54
-
55
-
56
-
57
-
58
-
59
-
60
-
61
-
62
-
63
-
64
-
65
-
66
-
67
-
68
-
69
-
70
 |
 |

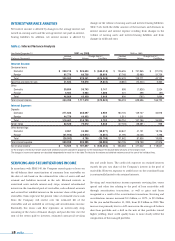
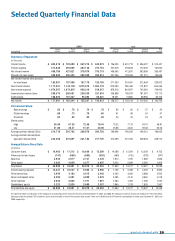
For the year ended December 31, 2001, the managed net charge-off
rate increased 14 basis points to 4.04%. The managed net charge-off
rate for the first three quarters of 2001 remained stable while the
fourth quarter managed net charge-off rate increased significantly
resulting in an overall increase for the year ended December 31, 2001.
This increase is a result of the seasoning of accounts originated in the
fourth quarter of the year ended December 31, 2000. For the year
ended December 31, 2001, the reported net charge-off rate decreased
64 basis points to 4.00%. The decrease in the reported net charge-off
rate was the result of a shift in the overall mix of the reported portfolio
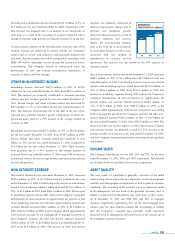
PROVISION AND ALLOWANCE FOR LOAN LOSSES
The allowance for loan losses is maintained at an amount estimated to
be sufficient to absorb probable losses, net of recoveries (including
recovery of collateral), inherent in the existing reported loan portfolio.
The provision for loan losses is the periodic cost of maintaining an
adequate allowance. Management believes that the allowance for loan
losses is adequate to cover anticipated losses in the reported
homogeneous consumer loan portfolio under current conditions.
There can be no assurance as to future credit losses that may be
incurred in connection with the Company’s consumer loan portfolio,
nor can there be any assurance that the loan loss allowance that has
been established by the Company will be sufficient to absorb such
future credit losses. The allowance is a general allowance applicable to
the entire reported homogeneous consumer loan portfolio. The
amount of allowance necessary is determined primarily based on a
migration analysis of delinquent and current accounts. In evaluating
the sufficiency of the allowance for loan losses, management also takes
into consideration the following factors: recent trends in delinquencies
and charge-offs including bankrupt, deceased and recovered amounts;
historical trends in loan volume; forecasting uncertainties and size of
credit risks; the degree of risk inherent in the composition of the loan
portfolio; economic conditions; credit evaluations and underwriting
policies. Additional information on the Company’s allowance for loan
loss policy can be found in Note A to the Consolidated Financial
Statements.
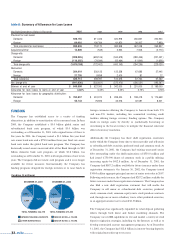
Table 8 sets forth the activity in the allowance for loan losses for the
periods indicated. See “Asset Quality,” “Delinquencies” and “Net
Charge-Offs” for a more complete analysis of asset quality.
For the year ended December 31, 2001, the provision for loan losses
increased to $989.8 million, or 38%, from the 2000 provision for loan
losses of $718.2 million. This increase is primarily a result of the 50%
increase in average reported loans, offset by a 64 basis point, or 14%,
decrease in the reported net charge-off rate as a result of the
aforementioned shift in the mix of the composition of the reported
portfolio. As a result of these factors, the Company increased the
allowance for loan losses by $313 million during 2001.
For the year ended December 31, 2000, the provision for loan losses
increased 88% to $718.2 million from the 1999 provision for loan
losses of $382.9 million as a result of an increase in average reported
loans 50%, continued seasoning of the reported portfolio and the shift
in the mix of the composition of the reported portfolio. As a result of
these factors, the Company increased the allowance for loan losses by
$185.0 million during 2000.
towards lower yielding, higher credit quality loans. Table 7 shows the
Company’s net charge-offs for the years presented on a reported and
managed basis.
The Company takes measures as necessary, including requiring
collateral on certain accounts and other marketing and account
management techniques, to maintain the Company’s credit quality
standards and to manage the risk of loss on existing accounts. See
“Risk Adjusted Revenue and Margin”for further discussion.
md&a 31
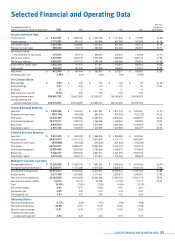
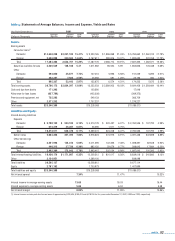
table 7: Net Charge-Offs
Year Ended December 31 (Dollars in Thousands) 2001 2000 1999 1998 1997
Reported:
Average loans outstanding $17,284,306 $ 11,487,776 $ 7,667,355 $ 5,348,559 $ 4,103,036
Net charge-offs 691,636 532,621 275,470 226,531 198,192
Net charge-offs as a percentage of
average loans outstanding 4.00% 4.64% 3.59% 4.24% 4.83%
Managed:
Average loans outstanding $35,612,317 $ 22,634,862 $ 18,046,913 $ 15,209,537 $ 13,007,182
Net charge-offs 1,438,370 883,667 694,073 810,306 856,704
Net charge-offs as a percentage of
average loans outstanding 4.04% 3.90% 3.85% 5.33% 6.59%