Capital One 2001 Annual Report Download - page 38
Download and view the complete annual report
Please find page 38 of the 2001 Capital One annual report below. You can navigate through the pages in the report by either clicking on the pages listed below, or by using the keyword search tool below to find specific information within the annual report.-
 1
1 -
2
-
3
-
4
-
5
-
6
-
7
-
8
-
9
-
10
-
11
-
12
-
13
-
14
-
15
-
16
-
17
-
18
-
19
-
20
-
21
-
22
-
23
-
24
-
25
-
26
-
27
-
 28
28 -
 29
29 -
 30
30 -
 31
31 -
 32
32 -
 33
33 -
 34
34 -
 35
35 -
 36
36 -
 37
37 -
 38
38 -
 39
39 -
 40
40 -
 41
41 -
 42
42 -
 43
43 -
 44
44 -
 45
45 -
 46
46 -
 47
47 -
 48
48 -
49
-
50
-
51
-
52
-
53
-
54
-
55
-
56
-
57
-
58
-
59
-
60
-
61
-
62
-
63
-
64
-
65
-
66
-
67
-
68
-
69
-
70
 |
 |

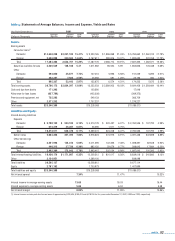
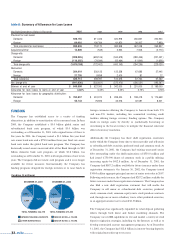
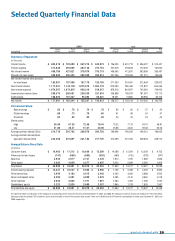
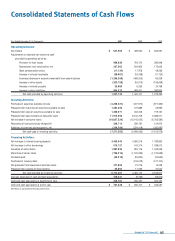
Table 12 reflects the interest rate repricing schedule for earning assets and interest-bearing liabilities as of December 31, 2001.
Product and Market Opportunities
Our strategy for future growth has been, and is expected to continue to
be, to apply our proprietary IBS to our lending business. We will seek
to identify new product opportunities and to make informed
investment decisions regarding new and existing products. Our
lending and other financial products are subject to competitive
pressures, which management anticipates will increase as these markets
mature.
Lending includes credit card and other consumer lending products,
such as automobile financing and unsecured installment lending.
Credit card opportunities include, and are expected to continue to
include, a wide variety of highly customized products with interest
rates, credit lines and other features specifically tailored for numerous
consumer segments. We expect continued growth across a broad
spectrum of new and existing customized products, which are
distinguished by a range of credit lines, pricing structures and other
characteristics. For example, our low rate products, which are typically
marketed to consumers with the best established credit profiles, are
characterized by higher credit lines, lower yields and an expectation of
lower delinquencies and credit loss rates. On the other hand, certain
BUSINESS OUTLOOK
Earnings, Goals and Strategies
This business outlook section summarizes Capital One’s expectations
for earnings for 2002, and our primary goals and strategies for
continued growth. The statements contained in this section are based
on management’s current expectations. Certain statements are
forward-looking and, therefore, actual results could differ materially.
Factors that could materially influence results are set forth throughout
this section and in Capital One’s Annual Report on Form 10-K for the
year ended December 31, 2001 (Part I, Item 1, Risk Factors).
We have set targets, dependent on the factors set forth below, to
increase Capital One’s earnings per share for 2002 by approximately
20% over earnings per share for the prior year. As discussed elsewhere
in this report and below, Capital One’s actual earnings are a function of
our revenues (net interest income and non-interest income on our
earning assets), consumer usage and payment patterns, credit quality
of our earning assets (which affects fees and charge-offs), marketing
expenses and operating expenses.
36 md&a
table 12: Interest Rate Sensitivity
Within >180 Days– >1 Year– Over
As of December 31, 2001 Subject to Repricing (Dollars in Millions) 180 Days 1 Year 5 Years 5 Years
Earning assets:
Federal funds sold and resale agreements $ 20
Interest-bearing deposits at other banks 332
Securities available for sale 55 $ 203 $ 749 $ 2,109
Consumer loans 8,097 1,800 7,903 3,121
Total earning assets 8,504 2,003 8,652 5,230
Interest-bearing liabilities:
Interest-bearing deposits 3,155 1,980 7,411 293
Other borrowings 500 292 4,144 399
Senior notes 1,408 557 1,720 311
Total interest-bearing liabilities 5,063 2,829 13,275 1,003
Non-rate related assets (2,219)
Interest sensitivity gap 3,441 (826) (4,623) 2,008
Impact of swaps 2,202 (348) (1,754) (100)
Impact of consumer loan securitizations (1,117) 1,168 (3,602) 3,551
Interest sensitivity gap adjusted for impact
of securitizations and swaps $ 4,526 $ (6) $ (9,979) $ 5,459
Adjusted gap as a percentage of managed assets 8.62% –.01% -19.01% 10.40%
Adjusted cumulative gap $ 4,526 $ 4,520 $ (5,459) $ —
Adjusted cumulative gap as a percentage
of managed assets 8.62% 8.61% -10.40% 0.00%