Capital One 2001 Annual Report Download - page 25
Download and view the complete annual report
Please find page 25 of the 2001 Capital One annual report below. You can navigate through the pages in the report by either clicking on the pages listed below, or by using the keyword search tool below to find specific information within the annual report.-
 1
1 -
2
-
3
-
4
-
5
-
6
-
7
-
8
-
9
-
10
-
11
-
12
-
13
-
14
-
 15
15 -
 16
16 -
 17
17 -
 18
18 -
 19
19 -
 20
20 -
 21
21 -
 22
22 -
 23
23 -
 24
24 -
 25
25 -
 26
26 -
 27
27 -
 28
28 -
 29
29 -
 30
30 -
 31
31 -
 32
32 -
 33
33 -
 34
34 -
 35
35 -
36
-
37
-
38
-
39
-
40
-
41
-
42
-
43
-
44
-
45
-
46
-
47
-
48
-
49
-
50
-
51
-
52
-
53
-
54
-
55
-
56
-
57
-
58
-
59
-
60
-
61
-
62
-
63
-
64
-
65
-
66
-
67
-
68
-
69
-
70
 |
 |

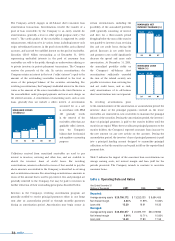
charge-off rate increase to 4.64% in 2000 from 3.59% in 1999. Non-
interest income increased $662.1 million, or 28%, primarily due to the
increase in average accounts of 41%. Increases in marketing expenses
of $174.2 million, or 24%, and salaries and benefits expense of $243.2
million, or 31%, reflect the increase in marketing investment in
existing and new product opportunities and the cost of operations to
manage the growth in the Company’s accounts and products offered.
Average managed consumer loans grew 25% for the year ended
December 31, 2000, to $22.6 billion from $18.0 billion for the year
ended December 31, 1999, and average accounts grew 41% for the
same period as a result of the continued success of the Company’s
marketing and account management strategies.
MANAGED CONSUMER LOAN PORTFOLIO
The Company analyzes its financial performance on a managed
consumer loan portfolio basis. Managed consumer loan data adds
back the effect of off-balance sheet consumer loans. The Company also
evaluates its interest rate exposure on a managed portfolio basis.
The Company’s managed consumer loan portfolio is comprised of
reported and off-balance sheet loans. Off-balance sheet loans are those
which have been securitized and accounted for as sales in accordance
with Statement of Financial Accounting Standards (“SFAS”) No. 140,
“Accounting for Transfers and Servicing of Financial Assets and
Extinguishments of Liabilities” (“SFAS 140”), and are not assets of the
Company. Therefore, those loans are not shown on the balance sheet.
SFAS 140 replaced SFAS 125 and was effective for securitization
transactions occurring after March 31, 2001. SFAS 140 revised the
standards for accounting for securitizations and other transfers of
financial assets and collateral and requires certain additional
disclosures; however, most of the provisions of SFAS 125 have been
carried forward without amendment. Accordingly, the Company has
modified or implemented several of its securitization trust agreements,
and may modify or implement others, to meet the new requirements
to continue recognizing transfers of consumer loans to special-purpose
entities as sales. The adoption of SFAS 140 did not have a material
effect on the results of the Company’s operations.
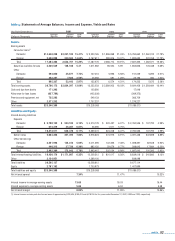
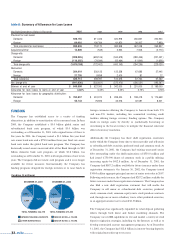
Table 1 summarizes the Company’s managed consumer loan portfolio.
md&a 23
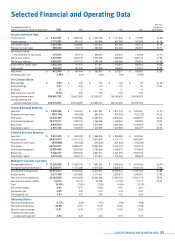
table 1: Managed Consumer Loan Portfolio
Year Ended December 31 (In Thousands) 2001 2000 1999 1998 1997
Year-End Balances:
Reported consumer loans:
Domestic $18,541,819 $ 12,580,973 $ 7,783,535 $ 4,569,664 $ 4,441,740
Foreign 2,379,195 2,531,739 2,130,014 1,587,447 419,947
Total 20,921,014 15,112,712 9,913,549 6,157,111 4,861,687
Off-balance sheet loans:
Domestic 22,747,293 13,961,714 10,013,424 10,933,984 9,369,328
Foreign 1,595,656 449,600 309,615 304,031
Total 24,342,949 14,411,314 10,323,039 11,238,015 9,369,328
Managed consumer loan portfolio:
Domestic 41,289,112 26,542,687 17,796,959 15,503,648 13,811,068
Foreign 3,974,851 2,981,339 2,439,629 1,891,478 419,947
Total $45,263,963 $ 29,524,026 $ 20,236,588 $ 1 7,395,126 $ 14,231,015
Average Balances:
Reported consumer loans:
Domestic $14,648,298 $ 9,320,165 $ 5,784,662 $ 4,336,757 $ 3,914,839
Foreign 2,636,008 2,167,611 1,882,693 1,011,802 188,197
Total 17,284,306 11,487,776 7,667,355 5,348,559 4,103,036
Off-balance sheet loans:
Domestic 17,718,683 10,804,845 10,062,771 9,773,284 8,904,146
Foreign 609,328 342,241 316,787 87,694
Total 18,328,011 11,147,086 10,379,558 9,860,978 8,904,146
Managed consumer loan portfolio:
Domestic 32,366,981 20,125,010 15,847,433 14,110,041 12,818,985
Foreign 3,245,336 2,509,852 2,199,480 1,099,496 188,197
Total $35,612,317 $ 22,634,862 $ 18,046,913 $ 15,209,537 $ 13,007,182