Capital One 2001 Annual Report Download - page 41
Download and view the complete annual report
Please find page 41 of the 2001 Capital One annual report below. You can navigate through the pages in the report by either clicking on the pages listed below, or by using the keyword search tool below to find specific information within the annual report.-
 1
1 -
2
-
3
-
4
-
5
-
6
-
7
-
8
-
9
-
10
-
11
-
12
-
13
-
14
-
15
-
16
-
17
-
18
-
19
-
20
-
21
-
22
-
23
-
24
-
25
-
26
-
27
-
28
-
29
-
30
-
 31
31 -
 32
32 -
 33
33 -
 34
34 -
 35
35 -
 36
36 -
 37
37 -
 38
38 -
 39
39 -
 40
40 -
 41
41 -
 42
42 -
 43
43 -
 44
44 -
 45
45 -
 46
46 -
 47
47 -
 48
48 -
 49
49 -
 50
50 -
 51
51 -
52
-
53
-
54
-
55
-
56
-
57
-
58
-
59
-
60
-
61
-
62
-
63
-
64
-
65
-
66
-
67
-
68
-
69
-
70
 |
 |

39
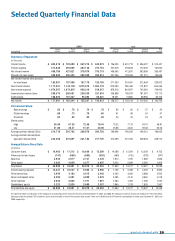
quarterly financial data 39
2001 2000
Fourth Third Second First Fourth Third Second First
(Unaudited) Quarter Quarter Quarter Quarter Quarter Quarter Quarter Quarter
Summary of Operations:
(In Thousands)
Interest income $804,618 $ 722,690 $ 657,216 $ 649,873 $706,235 $ 631,713 $ 536,507 $ 515,447
Interest expense 314,838 294,869 287,146 274,154 247,675 218,843 172,549 161,950
Net interest income 489,780 427,821 370,070 375,719 458,560 412,870 363,958 353,497
Provision for loan losses 305,889 230,433 202,900 250,614 247,226 193,409 151,010 126,525
Net interest income after provision
for loan losses 183,891 197,388 167,170 125,105 211,334 219,461 212,948 226,972
Non-interest income 1,177,251 1,144,190 1,073,676 1,024,776 872,080 796,469 710,807 655,060
Non-interest expense 1,074,567 1,074,897 990,316 918,247 876,516 818,957 742,264 709,920
Income before income taxes 286,575 266,681 250,530 231,634 206,898 196,973 181,491 172,112
Income taxes 108,894 101,337 95,203 88,021 78,621 74,850 68,966 65,403
Net income $177,681 $ 165,344 $ 155,327 $ 143,613 $128,277 $ 122,123 $ 112,525 $ 106,709
Per Common Share:
Basic earnings $.83 $ .78 $ .74 $ .70 $.65 $ .62 $ .57 $ .54
Diluted earnings .80 .75 .70 .66 .61 .58 .54 .51
Dividends .03 .03 .03 .03 .03 .03 .03 .03
Market prices
High 55.60 67.25 72.58 70.44 73.22 71.75 53.75 48.81
Low 41.00 36.41 51.61 46.90 45.88 44.60 39.38 32.06
Average common shares (000s) 214,718 210,763 209,076 204,792 196,996 196,255 196,012 196,645
Average common and common
equivalent shares (000s) 223,350 219,897 221,183 217,755 210,395 210,055 208,633 208,710
Average Balance Sheet Data:
(In Millions)
Consumer loans $19,402 $ 17,515 $ 16,666 $ 15,509 $14,089 $ 12,094 $ 10,029 $ 9,705
Allowance for loan losses (747) (660) (605) (539) (469) (415) (378) (347)
Securities 3,943 2,977 2,741 2,478 1,810 1,729 1,666 1,856
Other assets 4,382 4,059 3,277 2,907 2,530 2,699 2,380 1,825
Total assets $26,980 $ 23,891 $ 22,079 $ 20,355 $17,960 $ 16,107 $ 13,697 $ 13,039
Interest-bearing deposits $12,237 $ 10,537 $ 9,686 $ 8,996 $7,156 $ 5,788 $ 4,495 $ 3,894
Other borrowings 3,496 3,103 2,915 2,442 3,290 3,084 2,688 2,505
Senior and deposit notes 5,389 5,281 4,899 4,679 4,085 4,140 3,660 4,019
Other liabilities 2,635 2,035 1,971 1,891 1,564 1,352 1,228 1,054
Stockholders’ equity 3,223 2,935 2,608 2,347 1,865 1,743 1,626 1,567
Total liabilities and equity $26,980 $ 23,891 $ 22,079 $ 20,355 $17,960 $ 16,107 $ 13,697 $ 13,039
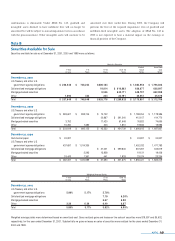
The above schedule is a tabulation of the Company’s unaudited quarterly results for the years ended December 31, 2001 and 2000.The Company’s common shares are traded on the New York Stock
Exchange under the symbol COF. In addition, shares may be traded in the over-the-counter stock market.There were 10,065 and 10,019 common stockholders of record as of December 31, 2001 and
2000, respectively.
Selected Quarterly Financial Data