Capital One 2001 Annual Report Download - page 65
Download and view the complete annual report
Please find page 65 of the 2001 Capital One annual report below. You can navigate through the pages in the report by either clicking on the pages listed below, or by using the keyword search tool below to find specific information within the annual report.-
 1
1 -
2
-
3
-
4
-
5
-
6
-
7
-
8
-
9
-
10
-
11
-
12
-
13
-
14
-
15
-
16
-
17
-
18
-
19
-
20
-
21
-
22
-
23
-
24
-
25
-
26
-
27
-
28
-
29
-
30
-
31
-
32
-
33
-
34
-
35
-
36
-
37
-
38
-
39
-
40
-
41
-
42
-
43
-
44
-
45
-
46
-
47
-
48
-
49
-
50
-
51
-
52
-
53
-
54
-
 55
55 -
 56
56 -
 57
57 -
 58
58 -
 59
59 -
 60
60 -
 61
61 -
 62
62 -
 63
63 -
 64
64 -
 65
65 -
 66
66 -
 67
67 -
 68
68 -
 69
69 -
 70
70
 |
 |

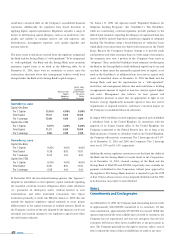
instruments and all non-financial instruments. Accordingly, the
aggregate fair value amounts presented do not represent the
underlying value of the Company.
The Company, in estimating the fair value of its financial instruments
as of December 31, 2001 and 2000, used the following methods and
assumptions:
Financial Assets
Cash and cash equivalents
The carrying amounts of cash and due from banks, federal funds sold
and resale agreements and interest-bearing deposits at other banks
approximated fair value.
Securities available for sale
The fair value of securities available for sale was determined using
current market prices. See Note B for fair values by type of security.
Consumer loans
The net carrying amount of consumer loans approximated fair value
due to the relatively short average life and variable interest rates on a
substantial number of these loans. This amount excluded any value
related to account relationships.
Interest receivable
The carrying amount approximated the fair value of this asset due to
its relatively short-term nature.
Accounts receivable from securitizations
The carrying amount approximated fair value.
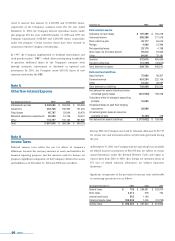
Derivatives
The carrying amount of derivatives approximated fair value and was
represented by the estimated unrealized gains as determined by quoted
market prices. This value generally reflects the estimated amounts that
the Corporation would have received to terminate the interest rate
swaps, currency swaps and forward foreign currency exchange (“f/x”)
contracts at the respective dates, taking into account the forward yield
curve on the swaps and the forward rates on the currency swaps and
f/x contracts. These derivatives are included in other assets on the
balance sheet.
Financial Liabilities
Interest-bearing deposits
The fair value of interest-bearing deposits was calculated by
discounting the future cash flows using estimates of market rates for
corresponding contractual terms.
Other borrowings
The carrying amount of federal funds purchased and resale agreements
and other short-term borrowings approximated fair value. The fair
value of secured borrowings was calculated by discounting the future
cash flows using estimates of market rates for corresponding
contractual terms and assumed maturities when no stated final
maturity was available. The fair value of the junior subordinated capital
income securities was determined based on quoted market prices.
Senior notes
The fair value of senior notes was determined based on quoted market
prices.
Interest payable
The carrying amount approximated the fair value of this asset due to
its relatively short-term nature.
Derivatives
The carrying amount of derivatives approximated fair value and was
represented by the estimated unrealized losses as determined by
quoted market prices. This value generally reflects the estimated
amounts that the Corporation would have paid to terminate the
interest rate swaps, currency swaps and f/x contracts at the respective
dates, taking into account the forward yield curve on the swaps and the
forward rates on the currency swaps and f/x contracts. These
derivatives are included in other liabilities on the balance sheet.
notes 63
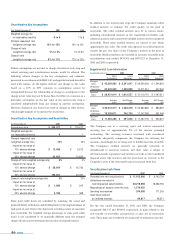
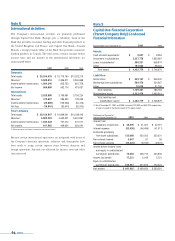
2001 2000
Carrying Estimated Carrying Estimated
Amount Fair Value Amount Fair Value
Financial Assets
Cash & cash
equivalents $707,238 $ 707,238 $ 236,707 $ 236,707
Securities
available
for sale 3,115,891 3,115,891 1,696,815 1,696,815
Net loans 20,081,014 20,081,014 14,585,712 14,585,712
Accounts
receivable from
securitizations 2,452,548 2,452,548 1,143,902 1,143,902
Interest
receivable 105,459 105,459 82,675 82,675
Derivatives 91,474 91,474 23,834
Financial Liabilities
Interest-bearing
deposits $12,838,968 $ 13,223,954 $ 8,379,025 $ 8,493,763
Senior notes 5,335,229 5,237,220 4,050,597 3,987,116
Other borrowings 3,995,528 4,047,865 2,925,938 2,924,113
Interest payable 188,160 188,160 122,658 122,658
Derivatives 199,976 199,976 62,965