Capital One 2001 Annual Report Download - page 28
Download and view the complete annual report
Please find page 28 of the 2001 Capital One annual report below. You can navigate through the pages in the report by either clicking on the pages listed below, or by using the keyword search tool below to find specific information within the annual report.-
 1
1 -
2
-
3
-
4
-
5
-
6
-
7
-
8
-
9
-
10
-
11
-
12
-
13
-
14
-
15
-
16
-
17
-
 18
18 -
 19
19 -
 20
20 -
 21
21 -
 22
22 -
 23
23 -
 24
24 -
 25
25 -
 26
26 -
 27
27 -
 28
28 -
 29
29 -
 30
30 -
 31
31 -
 32
32 -
 33
33 -
 34
34 -
 35
35 -
 36
36 -
 37
37 -
 38
38 -
39
-
40
-
41
-
42
-
43
-
44
-
45
-
46
-
47
-
48
-
49
-
50
-
51
-
52
-
53
-
54
-
55
-
56
-
57
-
58
-
59
-
60
-
61
-
62
-
63
-
64
-
65
-
66
-
67
-
68
-
69
-
70
 |
 |

NET INTEREST INCOME
Net interest income is interest and past-due fees earned from the
Company’s consumer loans and securities less interest expense on
borrowings, which include interest-bearing deposits, borrowings from
senior notes and other borrowings.
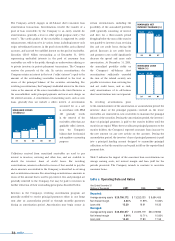
Reported net interest income for the year ended December 31, 2001,
was $1.7 billion compared to $1.6 billion for 2000, representing an
increase of $74.5 million, or 5%. Net interest income increased as a
result of growth in earning assets. Average earning assets increased 56%
for the year ended December 31, 2001, to $20.7 billion from $13.3
billion for the year ended December 31, 2000. The reported net interest
margin decreased to 8.03% in 2001, from 11.99% in 2000 primarily
attributable to a 462 basis point decrease in the yield on consumer loans
to 15.29% for the year ended December 31, 2001, from 19.91% for the
year ended December 31, 2000. The yield on consumer loans decreased
primarily due to a shift in the mix of the reported portfolio toward a
greater composition of lower yielding, higher credit quality loans, a
decrease in the frequency of past-due fees and a selective increase in the
use of low introductory rates as compared to the prior year.
The managed net interest margin for the year ended December 31,
2001, decreased to 9.04% from 10.71% for the year ended December
31, 2000. This decrease was primarily the result of a 234 basis point
decrease in consumer loan yield for the year ended December 31, 2001.
The decrease in consumer loan yield to 15.48% for the year ended
December 31, 2001, from 17.83% in 2000 was due to a shift in the mix
of the managed portfolio to lower yielding, higher credit quality loans,
as well as an increase in the amount of low introductory rate balances
as compared to the prior year.
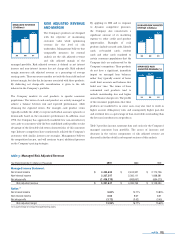
Reported net interest income for the year ended December 31, 2000,
was $1.6 billion, compared to $1.1 billion for 1999, representing an
increase of $536.3 million, or 51%. Net interest income increased as a
result of growth in earning assets and an increase in the net interest
margin. Average earning assets increased 37% for the year ended
December 31, 2000, to $13.3 billion from $9.7 billion for the year
ended December 31, 1999. The reported net interest margin increased
to 11.99% in 2000, from 10.86% in 1999 and was primarily
attributable to a 58 basis point increase in the yield on consumer loans
to 19.91% for the year ended December 31, 2000, from 19.33% for the
year ended December 31, 1999. The yield on consumer loans increased
primarily due to an increase in the frequency of past-due fees and a
slight shift in the mix of the portfolio to higher yielding assets as
compared to the prior year.
The managed net interest margin for the year ended December 31,
2000, decreased to 10.71% from 10.83% for the year ended December
31, 1999. This decrease was primarily the result of an increase of 74
basis points in borrowing costs to 6.53% in 2000, from 5.79% in 1999,
offset by a 24 basis point increase in consumer loan yield for the year
ended December 31, 2000. The increase in consumer loan yield to
17.83% for the year ended December 31, 2000, from 17.59% in 1999
was primarily the result of an increase in the frequency of past-due fees
as compared to the prior year
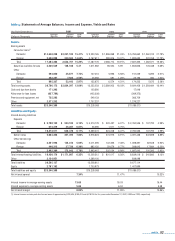
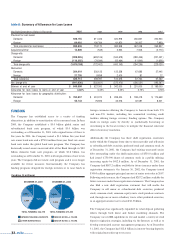
Table 4 provides average balance sheet data, an analysis of net interest
income, net interest spread (the difference between the yield on
earning assets and the cost of interest-bearing liabilities) and net
interest margin for each of the years ended December 31, 2001, 2000
and 1999.
26 md&a