Capital One 2001 Annual Report Download - page 30
Download and view the complete annual report
Please find page 30 of the 2001 Capital One annual report below. You can navigate through the pages in the report by either clicking on the pages listed below, or by using the keyword search tool below to find specific information within the annual report.-
 1
1 -
2
-
3
-
4
-
5
-
6
-
7
-
8
-
9
-
10
-
11
-
12
-
13
-
14
-
15
-
16
-
17
-
18
-
19
-
 20
20 -
 21
21 -
 22
22 -
 23
23 -
 24
24 -
 25
25 -
 26
26 -
 27
27 -
 28
28 -
 29
29 -
 30
30 -
 31
31 -
 32
32 -
 33
33 -
 34
34 -
 35
35 -
 36
36 -
 37
37 -
 38
38 -
 39
39 -
 40
40 -
41
-
42
-
43
-
44
-
45
-
46
-
47
-
48
-
49
-
50
-
51
-
52
-
53
-
54
-
55
-
56
-
57
-
58
-
59
-
60
-
61
-
62
-
63
-
64
-
65
-
66
-
67
-
68
-
69
-
70
 |
 |

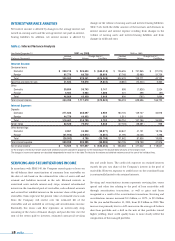
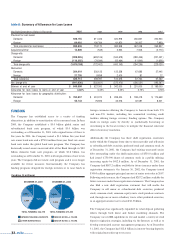
INTEREST VARIANCE ANALYSIS
Net interest income is affected by changes in the average interest rate
earned on earning assets and the average interest rate paid on interest-
bearing liabilities. In addition, net interest income is affected by
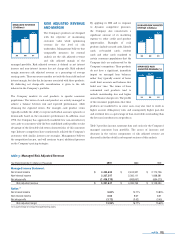
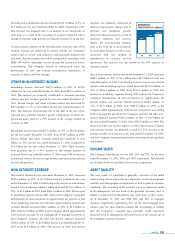
SERVICING AND SECURITIZATIONS INCOME
In accordance with SFAS 140, the Company records gains or losses on
the off-balance sheet securitizations of consumer loan receivables on
the date of sale based on the estimated fair value of assets sold and
retained and liabilities incurred in the sale. Retained interests in
securitized assets include interest-only strips, retained subordinated
interests in the transferred pool of receivables, cash collateral accounts
and accrued but unbilled interest on the investors’share of the pool of
receivables. Gains represent the present value of estimated excess cash
flows the Company will receive over the estimated life of the
receivables and are included in servicing and securitizations income.
Essentially, this excess cash flow represents an interest-only strip,
consisting of the excess of finance charges and past-due fees over the
sum of the return paid to investors, estimated contractual servicing
fees and credit losses. The credit risk exposure on retained interests
exceeds the pro rata share of the Company’s interest in the pool of
receivables. However, exposure to credit losses on the securitized loans
is contractually limited to the retained interests.
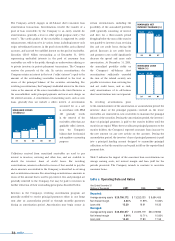
Servicing and securitizations income represents servicing fees, excess
spread and other fees relating to the pool of loan receivables sold
through securitization transactions, as well as gains and losses
recognized as a result of the securitization transactions. Servicing and
securitizations income increased $1.3 billion, or 112%, to $2.4 billion
for the year ended December 31, 2001, from $1.2 billion in 2000. This
increase was primarily due to a 64% increase in the average off-balance
sheet loan portfolio and a shift in the mix of that portfolio toward
higher yielding, lower credit quality loans to more closely reflect the
composition of the managed portfolio.
changes in the volume of earning assets and interest-bearing liabilities.
Table 5 sets forth the dollar amount of the increases and decreases in
interest income and interest expense resulting from changes in the
volume of earning assets and interest-bearing liabilities and from
changes in yields and rates.
28 md&a
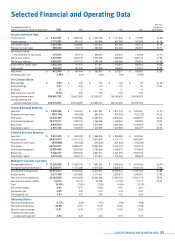
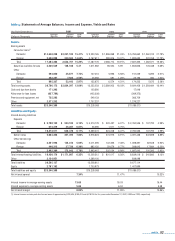
table 5: Interest Variance Analysis
Year Ended December 31 2001 vs. 2000 2000 vs. 1999
Increase Change Due to(1) Increase Change Due to(1)
(Dollars in Thousands) (Decrease) Volume Yield/Rate (Decrease) Volume Yield/Rate
Interest Income:
Consumer loans
Domestic $260,215 $ 926,633 $ (666,418) $ 736,655 $ 757,865 $ (21,210)
Foreign 95,778 66,728 29,050 67,748 35,989 31,759
Total 355,993 970,541 (614,548) 804,403 759,271 45,132
Securities available for sale 41,634 50,678 (9,044) (8,884) (14,244) 5,360
Other
Domestic 39,884 36,743 3,141 698 (1,826) 2,524
Foreign 6,984 5,984 1,000 201 298 (97)
Total 46,868 43,420 3,448 899 (765) 1,664
Total interest income 444,495 1,117,519 (673,024) 796,418 629,696 166,722
Interest Expense:
Deposits
Domestic 271,686 268,697 2,989 184,705 149,727 34,978
Foreign 44,776 44,422 354 1,511 1,511
Total 316,462 310,709 5,753 186,216 151,286 34,930
Senior notes 82,520 76,672 5,848 (27,723) (28,681) 958
Other borrowings
Domestic 2,961 33,938 (30,977) 59,847 41,121 18,726
Foreign (31,953) (28,072) (3,881) 41,795 40,006 1,798
Total (28,992) 6,708 (35,700) 101,642 81,806 19,836
Total interest expense 369,990 395,995 (26,005) 260,135 218,759 41,376
Net interest income(1) $74,505 $ 707,857 $ (633,352) $ 536,283 $ 417,642 $ 118,641
(1) The change in interest due to both volume and yield/rates has been allocated in proportion to the relationship of the absolute dollar amounts of the change in each.
The changes in income and expense are calculated independently for each line in the table.The totals for the volume and yield/rate columns are not the sum of the individual lines.