Capital One 2001 Annual Report Download - page 24
Download and view the complete annual report
Please find page 24 of the 2001 Capital One annual report below. You can navigate through the pages in the report by either clicking on the pages listed below, or by using the keyword search tool below to find specific information within the annual report.-
 1
1 -
2
-
3
-
4
-
5
-
6
-
7
-
8
-
9
-
10
-
11
-
12
-
13
-
 14
14 -
 15
15 -
 16
16 -
 17
17 -
 18
18 -
 19
19 -
 20
20 -
 21
21 -
 22
22 -
 23
23 -
 24
24 -
 25
25 -
 26
26 -
 27
27 -
 28
28 -
 29
29 -
 30
30 -
 31
31 -
 32
32 -
 33
33 -
 34
34 -
35
-
36
-
37
-
38
-
39
-
40
-
41
-
42
-
43
-
44
-
45
-
46
-
47
-
48
-
49
-
50
-
51
-
52
-
53
-
54
-
55
-
56
-
57
-
58
-
59
-
60
-
61
-
62
-
63
-
64
-
65
-
66
-
67
-
68
-
69
-
70
 |
 |
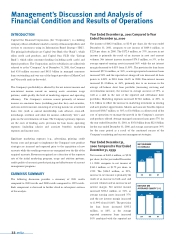
INTRODUCTION
Capital One Financial Corporation (the “Corporation”) is a holding
company whose subsidiaries market a variety of financial products and
services to consumers using its Information-Based Strategy (“IBS”).
The principal subsidiaries are Capital One Bank (the “Bank”), which
offers credit card products, and Capital One, F.S.B. (the “Savings
Bank”), which offers consumer lending (including credit cards) and
deposit products. The Corporation and its subsidiaries are collectively
referred to as the “Company.” As of December 31, 2001, the Company
had 43.8 million accounts and $45.3 billion in managed consumer
loans outstanding and was one of the largest providers of MasterCard
and Visa credit cards in the world.
The Company’s profitability is affected by the net interest income and
non-interest income earned on earning assets, consumer usage
patterns, credit quality, the level of marketing expense and operating
efficiency. The Company’s revenues consist primarily of interest
income on consumer loans (including past-due fees) and securities,
and non-interest income consisting of servicing income on securitized
loans, fees (such as annual membership, cash advance, cross-sell,
interchange, overlimit and other fee income, collectively “fees”) and
gains on the securitizations of loans. The Company’s primary expenses
are the costs of funding assets, provision for loan losses, operating
expenses (including salaries and associate benefits), marketing
expenses and income taxes.
Significant marketing expenses (e.g., advertising, printing, credit
bureau costs and postage) to implement the Company’s new product
strategies are incurred and expensed prior to the acquisition of new
accounts while the resulting revenues are recognized over the life of the
acquired accounts. Revenues recognized are a function of the response
rate of the initial marketing program, usage and attrition patterns,
credit quality of accounts, product pricing and effectiveness of account
management programs.
EARNINGS SUMMARY
The following discussion provides a summary of 2001 results
compared to 2000 results and 2000 results compared to 1999 results.
Each component is discussed in further detail in subsequent sections
of this analysis.
Year Ended December 31, 2001 Compared to Year
Ended December 31, 2000
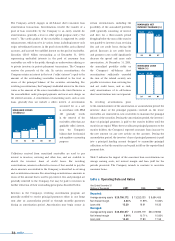
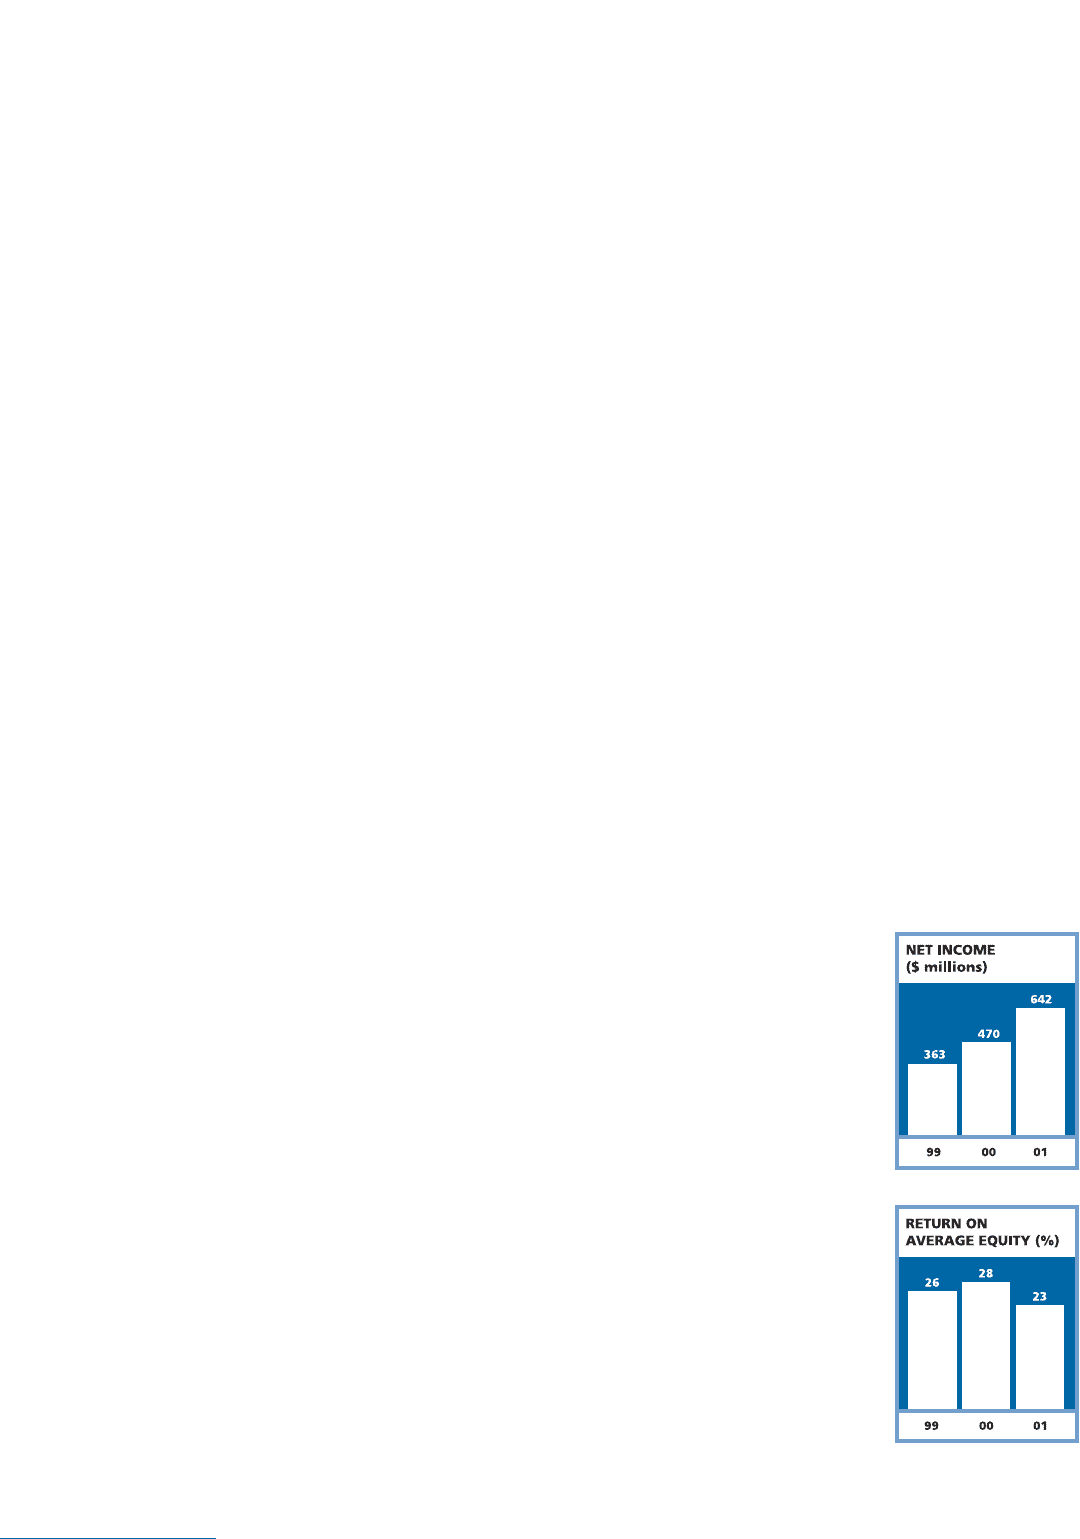
Net income of $642.0 million, or $2.91 per share, for the year ended
December 31, 2001, compares to net income of $469.6 million, or
$2.24 per share, in 2000. The $172.4 million, or 37%, increase in net
income is primarily the result of an increase in asset and account
volumes. Net interest income increased $74.5 million, or 5%, as the
average reported earning assets increased 56% while the net interest
margin decreased to 8.03% from 11.99%. The provision for loan losses
increased $271.6 million, or 38%, as average reported consumer loans
increased 50% and the reported net charge-off rate decreased 64 basis
points to 4.00% in 2001 from 4.64% in 2000. Non-interest income
increased $1.4 billion, or 46%, primarily due to an increase in the
average off-balance sheet loan portfolio (increasing servicing and
securitizations income), the increase in average accounts of 39%, as
well as a shift in the mix of the reported and off-balance sheet
portfolios. Marketing expenses increased $176.8 million, or 20%, to
$1.1 billion to reflect the increase in marketing investment in existing
and new product opportunities. Salaries and associate benefits expense
increased $368.7 million, or 36%, to $1.4 billion as a direct result of the
cost of operations to manage the growth in the Company’s accounts
and products offered. Average managed consumer loans grew 57% for
the year ended December 31, 2001, to $35.6 billion from $22.6 billion
for the year ended December 31, 2000, and average accounts grew 39%
for the same period as a result of the continued success of the
Company’s marketing and account management strategies.
Year Ended December 31,
2000 Compared to Year Ended
December 31, 1999
Net income of $469.6 million, or $2.24
per share, for the year ended December
31, 2000, compares to net income of
$363.1 million, or $1.72 per share, in
1999. The $106.5 million, or 29%,
increase in net income is primarily the
result of an increase in both asset and
account volumes and an increase in net
interest margin. Net interest income
increased $536.3 million, or 51%, as
average earning assets increased 37%
and the net interest margin increased
to 11.99% from 10.86%. The provision
for loan losses increased $335.2
million, or 88%, as the average
reported consumer loans increased
50% combined with the reported net
22 md&a
Management’s Discussion and Analysis of
Financial Condition and Results of Operations