Capital One 2001 Annual Report Download - page 23
Download and view the complete annual report
Please find page 23 of the 2001 Capital One annual report below. You can navigate through the pages in the report by either clicking on the pages listed below, or by using the keyword search tool below to find specific information within the annual report.-
 1
1 -
2
-
3
-
4
-
5
-
6
-
7
-
8
-
9
-
10
-
11
-
12
-
 13
13 -
 14
14 -
 15
15 -
 16
16 -
 17
17 -
 18
18 -
 19
19 -
 20
20 -
 21
21 -
 22
22 -
 23
23 -
 24
24 -
 25
25 -
 26
26 -
 27
27 -
 28
28 -
 29
29 -
 30
30 -
 31
31 -
 32
32 -
 33
33 -
34
-
35
-
36
-
37
-
38
-
39
-
40
-
41
-
42
-
43
-
44
-
45
-
46
-
47
-
48
-
49
-
50
-
51
-
52
-
53
-
54
-
55
-
56
-
57
-
58
-
59
-
60
-
61
-
62
-
63
-
64
-
65
-
66
-
67
-
68
-
69
-
70
 |
 |

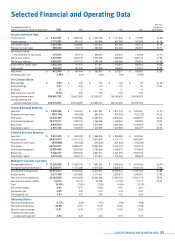
selected financial and operating data 21
Five-Year
Year Ended December 31 Compound
(Dollars in Thousands, Except Per Share Data) 2001 2000 1999 1998 1997 Growth Rate
Income Statement Data:
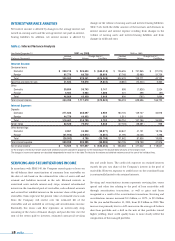
Interest income $ 2,834,397 $ 2,389,902 $ 1,593,484 $ 1,111,536 $ 717,985 33.82%
Interest expense 1,171,007 801,017 540,882 424,284 341,849 31.75
Net interest income 1,663,390 1,588,885 1,052,602 687,252 376,136 35.40
Provision for loan losses 989,836 718,170 382,948 267,028 262,837 42.71
Net interest income
after provision for loan losses 673,554 870,715 669,654 420,224 113,299 27.71%
Non-interest income 4,419,893 3,034,416 2,372,359 1,488,283 1,069,130 42.08
Non-interest expense 4,058,027 3,147,657 2,464,996 1,464,586 876,976 41.59
Income before income taxes 1,035,420 757,474 577,017 443,921 305,453 33.03
Income taxes 393,455 287,840 213,926 168,690 116,072 33.38
Net income $641,965 $ 469,634 $ 363,091 $ 275,231 $ 189,381 32.83
Dividend payout ratio 3.48% 4.43% 5.69% 7.46% 10.90%
Per Common Share:
Basic earnings $3.06 $ 2.39 $ 1.84 $ 1.40 $ .96 31.44%
Diluted earnings 2.91 2.24 1.72 1.32 .93 30.46
Dividends .11 .11 .11 .11 .11
Book value as of year-end 15.40 9.94 7.69 6.45 4.55
Average common shares 209,866,782 196,477,624 197,593,371 196,768,929 198,209,691
Average common and
common equivalent shares 220,576,093 209,448,697 210,682,740 208,765,296 202,952,592
Selected Average Balances:
Securities $3,038,360 $ 1,764,257 $ 2,027,051 $ 1,877,276 $ 1,650,961 21.51%
Allowance for loan losses (637,789) (402,208) (269,375) (214,333) (132,728) 50.15
Total assets 23,346,309 15,209,585 11,085,013 8,330,432 6,568,937 33.20
Interest-bearing deposits 10,373,511 5,339,474 2,760,536 1,430,042 958,885 58.22
Borrowings 8,056,665 6,870,038 6,078,480 5,261,588 4,440,393 17.33
Stockholders’ equity 2,781,182 1,700,973 1,407,899 1,087,983 824,077 32.67
Selected Year-End Balances:
Securities $3,467,449 $ 1,859,029 $ 1,968,853 $ 2,080,980 $ 1,475,354
Consumer loans 20,921,014 15,112,712 9,913,549 6,157,111 4,861,687
Allowance for loan losses (840,000) (527,000) (342,000) (231,000) (183,000)
Total assets 28,184,047 18,889,341 13,336,443 9,419,403 7,078,279
Interest-bearing deposits 12,838,968 8,379,025 3,783,809 1,999,979 1,313,654
Borrowings 9,330,757 6,976,535 6,961,014 5,481,593 4,526,550
Stockholders’ equity 3,323,478 1,962,514 1,515,607 1,270,406 893,259
Managed Consumer Loan Data:
Average reported loans $17,284,306 $ 11,487,776 $ 7,667,355 $ 5,348,559 $ 4,103,036 36.47%
Average off-balance sheet loans 18,328,011 11,147,086 10,379,558 9,860,978 8,904,146 19.20
Average total managed loans 35,612,317 22,634,862 18,046,913 15,209,537 13,007,182 25.88
Interest income 5,513,166 4,034,882 3,174,057 2,583,872 2,045,967 27.09
Year-end total managed loans 45,263,963 29,524,026 20,236,588 17,395,126 14,231,015 28.73
Year-end total accounts (000s) 43,815 33,774 23,705 16,706 11,747 38.54
Yield 15.48% 17.83% 17.59% 16.99% 15.73%
Net interest margin 9.04 10.71 10.83 9.91 8.81
Delinquency rate 4.95 5.23 5.23 4.70 6.20
Net charge-off rate 4.04 3.90 3.85 5.33 6.59
Operating Ratios:
Return on average assets 2.75% 3.09% 3.28% 3.30% 2.88%
Return on average equity 23.08 27.61 25.79 25.30 22.98
Equity to assets (average) 11.91 11.18 12.70 13.06 12.55
Allowance for loan losses
to loans as of year-end 4.02 3.49 3.45 3.75 3.76
Selected Financial and Operating Data