Capital One 2001 Annual Report Download - page 51
Download and view the complete annual report
Please find page 51 of the 2001 Capital One annual report below. You can navigate through the pages in the report by either clicking on the pages listed below, or by using the keyword search tool below to find specific information within the annual report.-
 1
1 -
2
-
3
-
4
-
5
-
6
-
7
-
8
-
9
-
10
-
11
-
12
-
13
-
14
-
15
-
16
-
17
-
18
-
19
-
20
-
21
-
22
-
23
-
24
-
25
-
26
-
27
-
28
-
29
-
30
-
31
-
32
-
33
-
34
-
35
-
36
-
37
-
38
-
39
-
40
-
 41
41 -
 42
42 -
 43
43 -
 44
44 -
 45
45 -
 46
46 -
 47
47 -
 48
48 -
 49
49 -
 50
50 -
 51
51 -
 52
52 -
 53
53 -
 54
54 -
 55
55 -
 56
56 -
 57
57 -
 58
58 -
 59
59 -
 60
60 -
 61
61 -
62
-
63
-
64
-
65
-
66
-
67
-
68
-
69
-
70
 |
 |

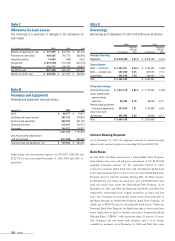
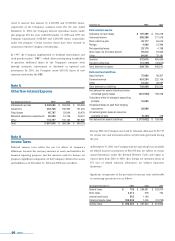
combinations is eliminated. Under SFAS No. 142, goodwill and
intangible assets deemed to have indefinite lives will no longer be
amortized but will be subject to annual impairment tests in accordance
with the pronouncement. Other intangible assets will continue to be
amortized over their useful lives. During 2002, the Company will
perform the first of the required impairment tests of goodwill and
indefinite-lived intangible assets. The adoption of SFAS No. 142 in
2002 is not expected to have a material impact on the earnings or
financial position of the Company.
notes 49
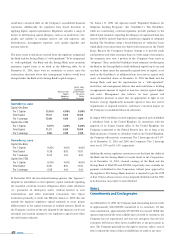
Note B
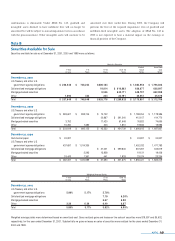
Securities Available for Sale
Securities available for sale as of December 31, 2001, 2000 and 1999 were as follows:
Maturity Schedule
Market Amortized
1 Year 1–5 5–10 Over 10 Value Cost
or Less Years Years Years Totals Totals
December 31, 2001
U.S. Treasury and other U.S.
government agency obligations $256,548 $ 748,224 $800,184 $ 1,804,956 $ 1,796,033
Collateralized mortgage obligations 19,814 $ 616,863 636,677 628,897
Mortgage-backed securities 8,536 640,171 648,707 662,098
Other 1,092 424 244 23,791 25,551 25,678
Total $257,640 $ 748,648 $828,778 $1,280,825 $ 3,115,891 $ 3,112,706
December 31, 2000
U.S. Treasury and other U.S.
government agency obligations $ 283,607 $ 893,745 $ 10,702 $ 1,188,054 $ 1,178,386
Collateralized mortgage obligations 20,867 $ 391,240 412,107 414,770
Mortgage-backed securities 3,752 11,420 61,648 76,820 74,695
Other 16,260 1,380 343 1,851 19,834 19,986
Total $ 303,619 $ 895,125 $ 43,332 $ 454,739 $ 1,696,815 $ 1,687,837
December 31, 1999
Commercial paper $ 24,927 $ 24,927 $ 24,927
U.S. Treasury and other U.S.
government agency obligations 437,697 $ 1,014,335 1,452,032 1,471,783
Collateralized mortgage obligations $ 37,421 $ 299,846 337,267 345,619
Mortgage-backed securities 5,293 13,828 19,121 19,426
Other 19,443 1,361 441 1,829 23,074 23,254
Total $ 482,067 $ 1,020,989 $ 51,690 $ 301,675 $ 1,856,421 $ 1,885,009
Weighted Average Yields
1 Year 1–5 5–10 Over 10
or Less Years Years Years
December 31, 2001
U.S. Treasury and other U.S.
government agency obligations 5.90% 5.17% 5.78%
Collateralized mortgage obligations 7.10 6.20%
Mortgage-backed securities 6.67 6.00
Other 3.26 6.36 6.49 6.07
Total 5.89% 5.17% 5.82% 6.09%
Weighted average yields were determined based on amortized cost. Gross realized gains and losses on the sales of securities were $19,097 and $5,602,
respectively, for the year ended December 31, 2001. Substantially no gains or losses on sales of securities were realized for the years ended December 31,
2000 and 1999.