Berkshire Hathaway 2001 Annual Report Download - page 8
Download and view the complete annual report
Please find page 8 of the 2001 Berkshire Hathaway annual report below. You can navigate through the pages in the report by either clicking on the pages listed below, or by using the keyword search tool below to find specific information within the annual report.-
 1
1 -
 2
2 -
 3
3 -
 4
4 -
 5
5 -
 6
6 -
 7
7 -
 8
8 -
 9
9 -
 10
10 -
 11
11 -
 12
12 -
 13
13 -
 14
14 -
 15
15 -
 16
16 -
 17
17 -
 18
18 -
 19
19 -
20
-
21
-
22
-
23
-
24
-
25
-
26
-
27
-
28
-
29
-
30
-
31
-
32
-
33
-
34
-
35
-
36
-
37
-
38
-
39
-
40
-
41
-
42
-
43
-
44
-
45
-
46
-
47
-
48
-
49
-
50
-
51
-
52
-
53
-
54
-
55
-
56
-
57
-
58
-
59
-
60
-
61
-
62
-
63
-
64
-
65
-
66
-
67
-
68
-
69
-
70
-
71
-
72
-
73
-
74
 |
 |

7
Historically, Berkshire has obtained its float at a very low cost. Indeed, our cost has been less than zero in
about half of the years in which weve operated; that is, weve actually been paid for holding other peoples money.
Over the last few years, however, our cost has been too high, and in 2001 it was terrible.
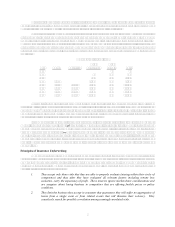
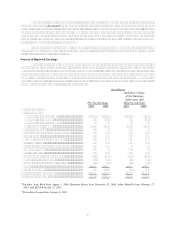
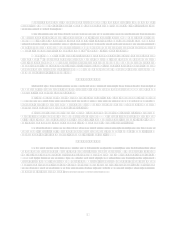
The table that follows shows (at intervals) the float generated by the various segments of Berkshires
insurance operations since we entered the business 35 years ago upon acquiring National Indemnity Company
(whose traditional lines are included in the segment Other Primary). For the table we have calculated our float
which we generate in large amounts relative to our premium volume by adding net loss reserves, loss adjustment
reserves, funds held under reinsurance assumed and unearned premium reserves, and then subtracting insurance-
related receivables, prepaid acquisition costs, prepaid taxes and deferred charges applicable to assumed reinsurance.
(Got that?)
Yearend Float (in $ millions)
Other Other
Year GEICO General Re Reinsurance Primary Total
1967 20 20
1977 40 131 171
1987 701 807 1,508
1997 2,917 4,014 455 7,386
1998 3,125 14,909 4,305 415 22,754
1999 3,444 15,166 6,285 403 25,298
2000 3,943 15,525 7,805 598 27,871
2001 4,251 19,310 11,262 685 35,508
Last year I told you that, barring a mega-catastrophe, our cost of float would probably drop from its 2000
level of 6%. I had in mind natural catastrophes when I said that, but instead we were hit by a man-made catastrophe
on September 11th an event that delivered the insurance industry its largest loss in history. Our float cost therefore
came in at a staggering 12.8%. It was our worst year in float cost since 1984, and a result that to a significant
degree, as I will explain in the next section, we brought upon ourselves.
If no mega-catastrophe occurs, I once again expect the cost of our float to be low in the coming year.
We will indeed need a low cost, as will all insurers. Some years back, float costing, say, 4% was tolerable because
government bonds yielded twice as much, and stocks prospectively offered still loftier returns. Today, fat returns
are nowhere to be found (at least we cant find them) and short-term funds earn less than 2%. Under these
conditions, each of our insurance operations, save one, must deliver an underwriting profit if it is to be judged a
good business. The exception is our retroactive reinsurance operation (a business we explained in last years annual
report), which has desirable economics even though it currently hits us with an annual underwriting loss of about
$425 million.
Principles of Insurance Underwriting
When property/casualty companies are judged by their cost of float, very few stack up as satisfactory
businesses. And interestingly unlike the situation prevailing in many other industries neither size nor brand
name determines an insurers profitability. Indeed, many of the biggest and best-known companies regularly
deliver mediocre results. What counts in this business is underwriting discipline. The winners are those that
unfailingly stick to three key principles:
1. They accept only those risks that they are able to properly evaluate (staying within their circle of
competence) and that, after they have evaluated all relevant factors including remote loss
scenarios, carry the expectancy of profit. These insurers ignore market-share considerations and
are sanguine about losing business to competitors that are offering foolish prices or policy
conditions.
2. They limit the business they accept in a manner that guarantees they will suffer no aggregation of
losses from a single event or from related events that will threaten their solvency. They
ceaselessly search for possible correlation among seemingly-unrelated risks.