Berkshire Hathaway 2001 Annual Report Download - page 47
Download and view the complete annual report
Please find page 47 of the 2001 Berkshire Hathaway annual report below. You can navigate through the pages in the report by either clicking on the pages listed below, or by using the keyword search tool below to find specific information within the annual report.-
 1
1 -
2
-
3
-
4
-
5
-
6
-
7
-
8
-
9
-
10
-
11
-
12
-
13
-
14
-
15
-
16
-
17
-
18
-
19
-
20
-
21
-
22
-
23
-
24
-
25
-
26
-
27
-
28
-
29
-
30
-
31
-
32
-
33
-
34
-
35
-
36
-
 37
37 -
 38
38 -
 39
39 -
 40
40 -
 41
41 -
 42
42 -
 43
43 -
 44
44 -
 45
45 -
 46
46 -
 47
47 -
 48
48 -
 49
49 -
 50
50 -
 51
51 -
 52
52 -
 53
53 -
 54
54 -
 55
55 -
 56
56 -
 57
57 -
58
-
59
-
60
-
61
-
62
-
63
-
64
-
65
-
66
-
67
-
68
-
69
-
70
-
71
-
72
-
73
-
74
 |
 |

46
Notes to Consolidated Financial Statements (Continued)
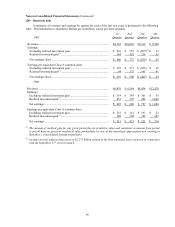
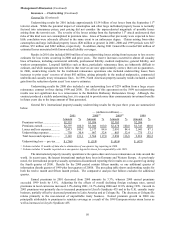
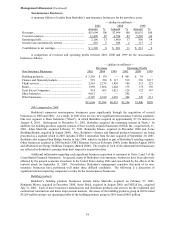
(20) Quarterly data
A summary of revenues and earnings by quarter for each of the last two years is presented in the following
table. This information is unaudited. Dollars are in millions, except per share amounts.
1st 2nd 3rd 4th
2001 Quarter Quarter Quarter Quarter
Revenues................................................................................................. $8,142 $10,656 $9,310 $ 9,560
Earnings:
Excluding realized investment gain ..................................................... $ 462 $ 353 $ (895)(2) $ 33
Realized investment gain(1) .................................................................. 144 420 216 62
Net earnings (loss) ............................................................................... $ 606 $ 773 $ (679) $ 95
Earnings per equivalent Class A common share:
Excluding realized investment gain ..................................................... $ 303 $ 231 $ (586) $ 22
Realized investment gain(1) .................................................................. 94 275 141 41
Net earnings (loss) ............................................................................... $ 397 $ 506 $ (445) $ 63
2000
Revenues ................................................................................................. $6,479 $ 6,564 $8,434 $12,529
Earnings:
Excluding realized investment gain ...................................................... $ 354 $ 245 $ 301 $ 36
Realized investment gain(1) ................................................................... 453 395 496 1,048
Net earnings.......................................................................................... $ 807 $ 640 $ 797 $ 1,084
Earnings per equivalent Class A common share:
Excluding realized investment gain ...................................................... $ 233 $ 161 $ 197 $ 23
Realized investment gain(1) ................................................................... 298 260 326 687
Net earnings.......................................................................................... $ 531 $ 421 $ 523 $ 710
(1) The amount of realized gain for any given period has no predictive value and variations in amount from period
to period have no practical analytical value particularly in view of the unrealized appreciation now existing in
Berkshire’s consolidated investment portfolio.
(2) Includes pre-tax underwriting losses of $2.275 billion related to the then estimated losses incurred in connection
with the September 11th terrorist attack.